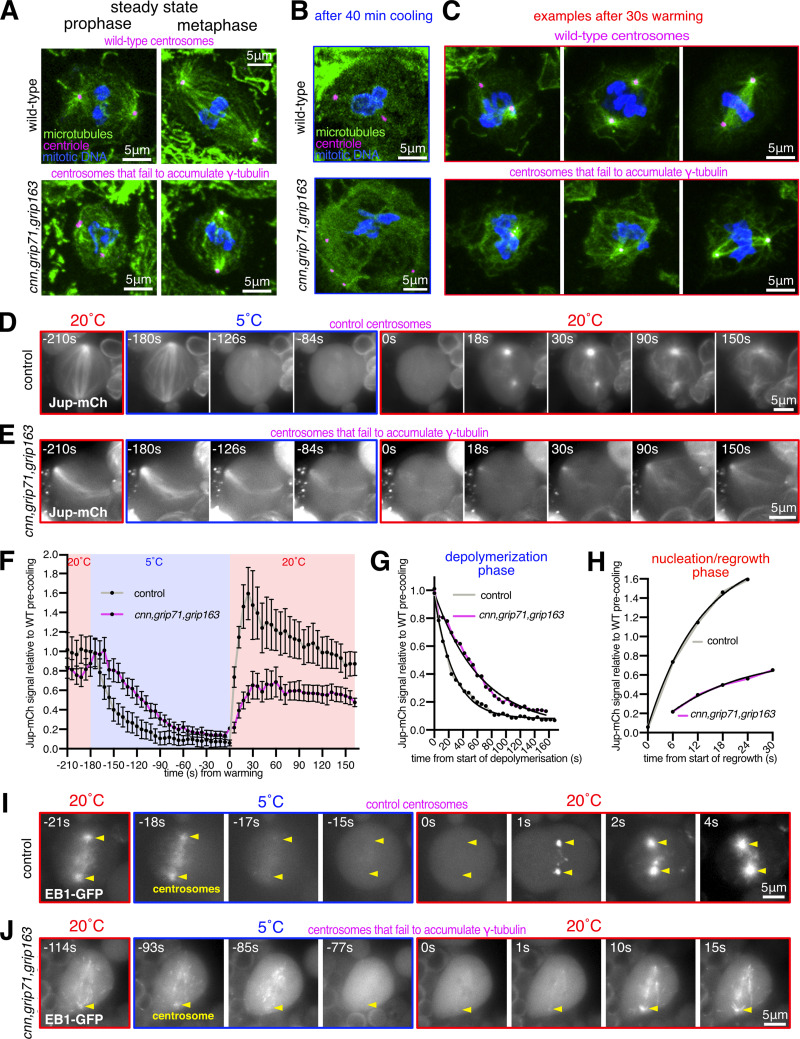
Figure 3.
Mitotic centrosomes that fail to accumulate γ-tubulin can still nucleate microtubules. (A–C) Fluorescence images of mitotic Drosophila brain cells from either wild-type or cnn,grip71,grip163 mutant third instar larval brains, either at steady state (A), after 40 min of cooling on ice (B), or after 30 s of warming (post cooling) to room temperature (C) immunostained for alpha-tubulin (microtubules, green), mitotic DNA (blue), and Asl (centrioles, magenta). Note how centrosomes in both wild-type and cnn,grip71,grip163 mutant cells are associated with microtubules both at steady state and after 30 s warming. Note that some cells lacking Cnn have abnormal numbers of centrosomes due to centrosome segregation problems during cell division (Conduit et al., 2010). (D–F) Fluorescent images (D and E) and graph (F) documenting the behavior of the microtubule marker Jupiter-mCherry within living Drosophila control (D) or cnn,grip71,grip163 mutant (E) third instar larval brain cells as they were cooled to 5°C for ∼3 min and then rapidly warmed to 20°C. Time in seconds relative to the initiation of warming (0 s) is indicated. Note that the GFP-PACT signal used to locate centrosomes is not displayed. The graph in F plots the mean and SEM centrosomal signal (after subtraction of cytosolic signal) of 12 and 10 centrosomes from 7 and 10 control and cnn,grip71,grip163 mutant cells, respectively. The data is normalized to the average signal at centrosomes in control cells prior to cooling. Note how the centrosomal Jupiter-mCherry signal quickly drops on cooling and then immediately increases on warming in both control and cnn,grip71,grip163 mutant cells, showing that centrosomes within both control and cnn,grip71,grip163 mutant cells nucleate microtubules. (G and H) Graphs show the depolymerization (G) and nucleation/regrowth phases (H) phases from the graph in F. One-phase exponential decay models and “exponential plateau” models generated in GraphPad Prism using least squares fit are fitted to the depolymerization and nucleation/regrowth phases, respectively. The fits were compared using an extra sum-of-squares F test. Note how the centrosomal Jupiter-mCherry signal decreases faster upon cooling, but increases slower upon warming, in cnn,grip71,grip163 mutant cells. (I and J) Fluorescent images documenting the behavior of the microtubule plus-end marker EB1-GFP within living Drosophila control (I) and cnn,grip71,grip163 mutant (J) third instar larval brain cells as they were cooled to 5°C and then rapidly warmed to 20°C. Time in seconds relative to the initiation of warming (0 s) is indicated. Note how the EB1-GFP signal emanates from the centrosome and from the spindle/chromatin region during warming in the cnn,grip71,grip163 mutant cell.

