Figure 5.
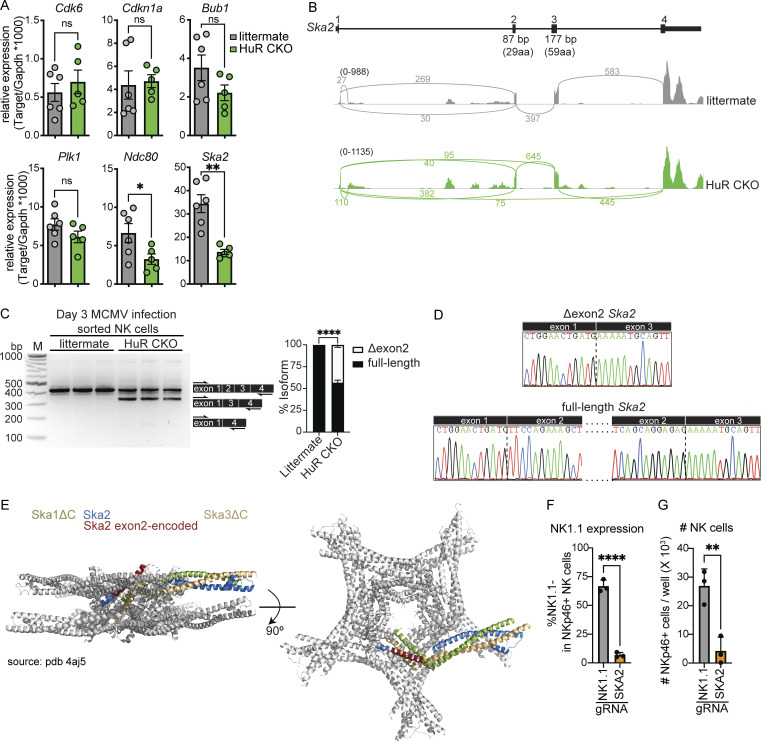
Ska2 is aberrantly spliced in HuR-deficient NK cells, which causes decreased NK cell expansion. (A) Splenic NK cells were sorted from day 3 MCMV-infected animals and relative mRNA copy number was analyzed by TaqMan qPCR. Cumulative data from two independent experiments totaling five to six mice per group. (B) Sashimi plot displaying Ska2 mRNA splicing in HuR CKO and littermate control NK cells. Sashimi plots are representative of the splicing dataset. (C) PCR along exon 1 to exon 4 of Ska2 to analyze alternative splicing in splenic NK cells isolated from day 3 MCMV-infected animals. The band intensity of different isoforms was analyzed using image lab software. Representative data from two independent experiments with three mice per group. M, marker. (D) The nucleotide sequences of gel-excised bands were analyzed by Sanger sequencing. (E) Cartoon representation of the structure of the Ska core complex using PDB 4aj5. Indicated in red is the portion of Ska2 encoded by exon 2 in 1 out of 10 Ska2 molecules within the Ska complex. (F and G) C57BL/6 splenocytes were electroporated with Cas9 and specific gRNAs and cultured with IL-15 for 4 d. NKp46+CD3−CD19− NK cells were analyzed for NK1.1 expression (F) and cell number (G). Representative data from two independent experiments with three mice per group. Statistics were calculated with unpaired t tests. Error bars indicate SEM; ns, not significant; *P < 0.05, **P < 0.01, and ****P < 0.0001. Source data are available for this figure: SourceData F5.

