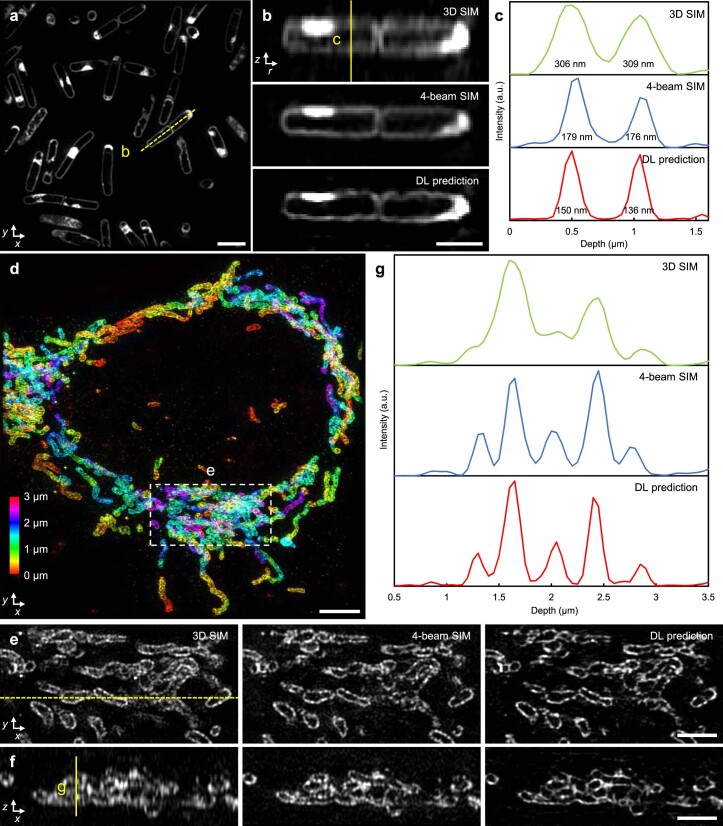
Extended Data Fig. 4. Images of additional samples, comparing deep learning isotropization output to 3D SIM and four-beam SIM.
a) DL prediction images of live B. subtilis stained for membrane (CellBrite Fix 488). b) Axial views along dashed yellow line shown in a), comparing 3D SIM (top), four-beam SIM (middle), and deep learning (DL) prediction based on 3D SIM input. c) Line profiles corresponding to yellow vertical line in b). Full width at half maximum (FWHM) values under each peak are indicated. d) Depth-color coded images of immunolabeled Tomm20 in fixed U2OS cells. Maximum intensity projection of DL prediction is shown. e) Higher magnification views of dashed region in d), with lateral (top) and corresponding axial views f) (corresponding to dashed yellow line in lateral view) comparing 3D SIM (left), four-beam SIM (middle) and DL prediction (right). g) Line profiles along yellow vertical line in f). Scale bars: 2 µm a, e, f), 1 µm b), 4 µm d). a.u., arbitrary units.

