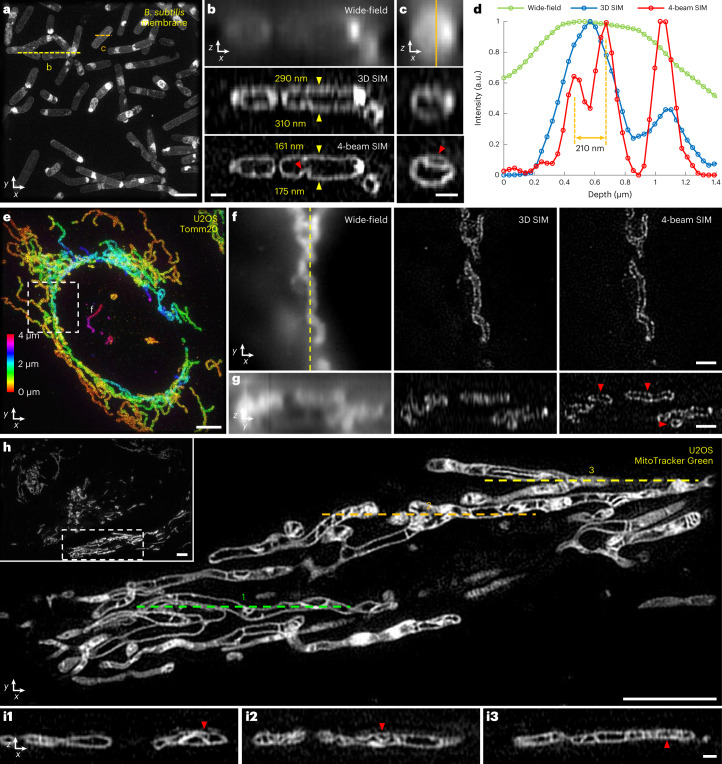
Fig. 2. Four-beam SIM enables near-isotropic imaging of biological samples.
a, Maximum intensity projection of live vegetative B. subtilis stained with CellBrite Fix 488, marking membranes, imaged in four-beam SIM. b,c, Axial views along yellow (b) and orange (c) dashed lines in a, comparing wide-field microscopy (top), 3D SIM (middle) and four-beam SIM (bottom). Yellow arrowheads in b highlight upper and lower cell membranes (numbered values indicate apparent membrane thickness); red arrowheads highlight membrane invaginations. See also Supplementary Video 2. d, Line profiles corresponding to vertical orange line in c. e, Maximum intensity projection of fixed U2OS cells labeled with Tomm20 primary and rabbit Alexa Fluor 488 secondary antibodies, marking outer mitochondrial membrane. Image is depth coded as indicated. Higher magnification lateral views (single planes) (f) corresponding to white dashed rectangle in e are shown, comparing wide-field microscopy (left), 3D SIM (middle) and four-beam SIM (right), in addition to corresponding axial views (g) taken across vertical yellow dashed line in f. Red arrowheads highlight void regions obscured in 3D SIM and wide-field microscopy. See also Supplementary Video 3. h, Overview (inset) and higher magnification view of single lateral plane of mitochondria labeled with MitoTracker Green FM in live U2OS cells, highlighting inner mitochondrial substructure. i, Axial cross-sections taken along green, orange and yellow dashed lines in h highlight fine substructure within mitochondria (red arrowheads). See also Supplementary Video 4. All data were acquired with 1.35 NA silicone immersion objective, with samples index-matched in 45.6% iodixanol. Scale bars, 2 µm (a); 500 nm (b,c,i); 4 µm (e,h); and 1 µm (f,g). a.u., arbitrary units.

