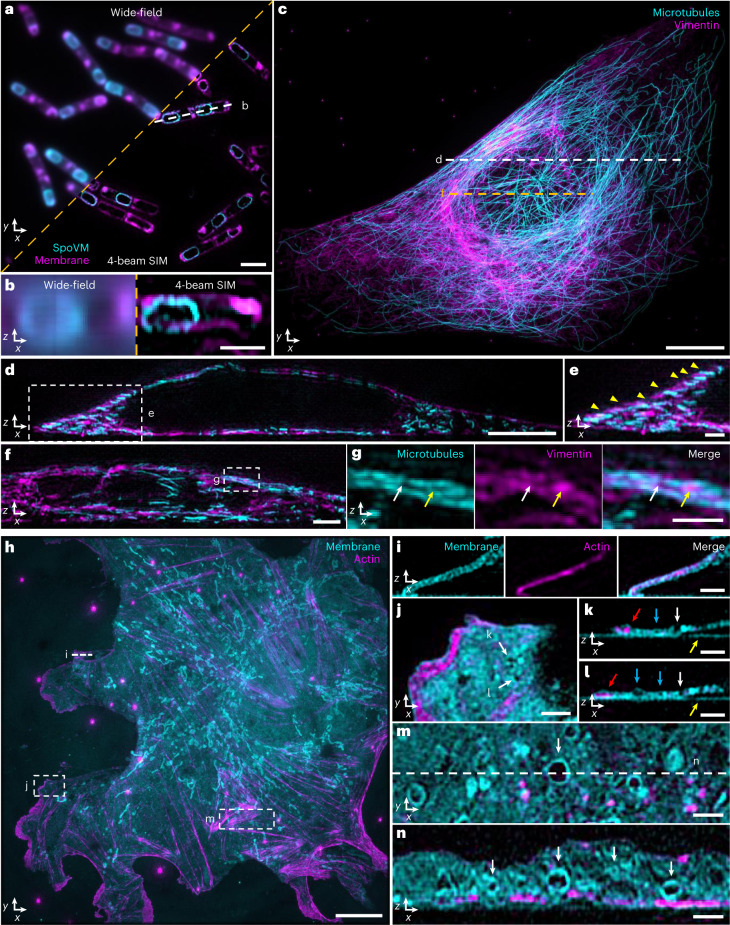
Fig. 3. Near-isotropic imaging in two colors via four-beam SIM.
a, Single lateral plane of live, sporulating B. subtilis with SpoVM-GFP label, marking spores (cyan), and CellBrite Fix 555 label, marking membrane (magenta). b, Axial view (single plane) along white dashed line in a. Images to the left of orange dashed line in a and b show wide-field images for comparison. c, Maximum intensity projection of fixed U2OS cells with Alexa Fluor 488-immunolabeled microtubules (cyan) and Alexa Fluor 594-immunolabeled labeled vimentin (magenta). d, Axial view corresponding to white dashed line in c. e, Higher magnification view of white dashed rectangular region in d, indicating apparent alternating stratification of microtubules and vimentin filaments (yellow arrowheads). Image is a maximum intensity projection over ten planes. f, Axial view corresponding to dashed orange line in c. Image is a maximum intensity projection over five planes. g, Higher magnification view of white dashed rectangular region in f, highlighting apparent ‘filling’ of inter-microtubule gaps by vimentin (arrows). Microtubule (left), vimentin (middle) and merged (right) images are shown. h, Maximum intensity projection image of fixed mouse LSECs with CellBrite Fix 488 label, marking membrane (cyan), and Alexa Fluor 568 phalloidin, marking actin filaments (magenta). See also Supplementary Video 6. i, Axial view corresponding to white dashed line in h, highlighting membrane signal encapsulating actin. Image is a maximum intensity projection over three planes. j, Higher magnification view of white dashed rectangular region in h with membrane pores highlighted (white arrows). k,l, Corresponding axial views to j, again highlighting the same pores (white arrows). Red arrows: actin encapsulated within membrane; blue arrows: void areas enclosed by membrane; yellow arrows: non-specific labeling of coverslip with membrane dye. m, Higher magnification view of dashed rectangular region in h, with accompanying cross-sectional view (n) corresponding to white dashed line in m, highlighting membrane-bound organelles (white arrows). Scale bars, 2 µm (a,f); 1 µm (b,e,g,i–n); 10 µm (c,h); and 5 µm (d). All images were acquired with four-beam SIM unless otherwise noted.

