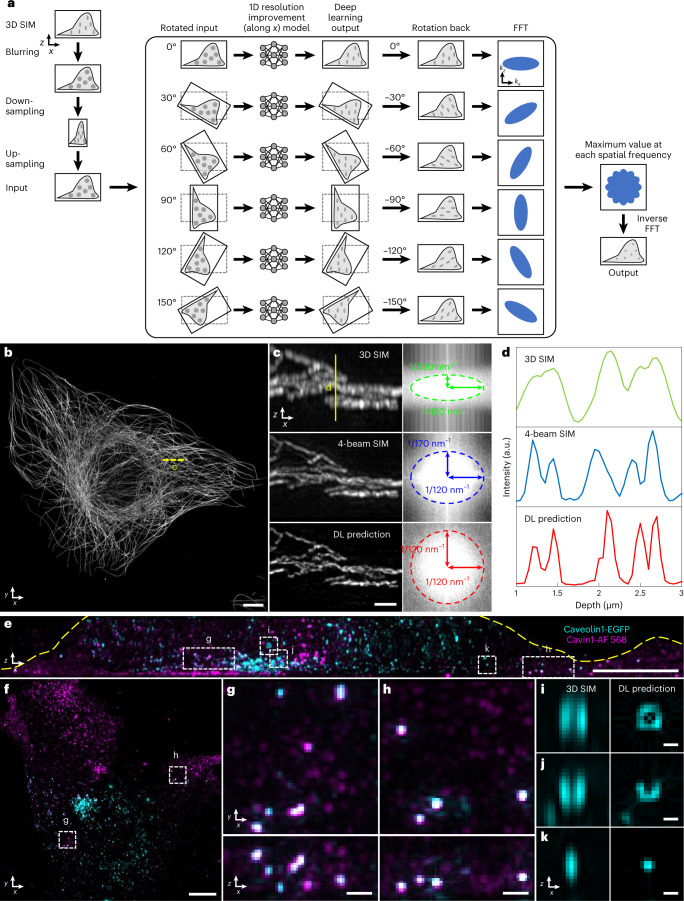
Fig. 4. Deep learning for axial resolution enhancement.
a, Schematic of deep learning process. 3D SIM image volumes are blurred, downsampled and upsampled (each along the lateral x direction) to render isotropic, low-resolution input data (resolution equivalent to axial resolution in 3D SIM). This input (1) is rotated in 30° increments; (2) each rotation is passed through a deep learning model to improve resolution along the x direction, (3) rotated back to the original frame and (4) Fourier transformed; (5) the maximum value, taken over all rotations, at each spatial frequency was recorded and, finally, (6) inverse Fourier transformed to yield an output prediction with improved isotropic resolution. See also Supplementary Fig. 14 and Methods. b, Alexa Fluor 488-immunolabeled microtubules in a fixed U2OS cell. Maximum intensity projection of deep learning prediction is shown. c, Left: higher magnification axial view indicated by yellow dashed line in b, comparing 3D SIM (top), four-beam SIM (middle) and deep learning prediction (bottom). Images are generated by computing maximum intensity projection over 20 pixels in the y direction. Right: magnitudes of Fourier transforms corresponding to images at left, with indicated spatial frequencies bounding the major and minor ellipse axes. d, Line profiles corresponding to yellow solid line in c. e,f, Fixed MEF with caveolin-1 EGFP with GFP booster (cyan) and Alexa Fluor 568-immunolabeled cavin-1 (magenta). Axial (e) and lateral (f) maximum intensity projections of deep learning predictions are shown. Yellow dashed line in e has been added to better delineate the cell boundary. g,h, Higher magnification views of dashed rectangular regions in e and f with lateral (top) and axial (bottom) projections indicated. i–k, Higher magnification axial views of regions indicated in e, comparing 3D SIM input (left) to deep learning prediction (right). See also Supplementary Fig. 15. Scale bars, 5 µm (b,e,f); 1 µm (c); 500 nm (g,h); and 200 nm (i–k). a.u., arbitrary units; DL, deep learning.

