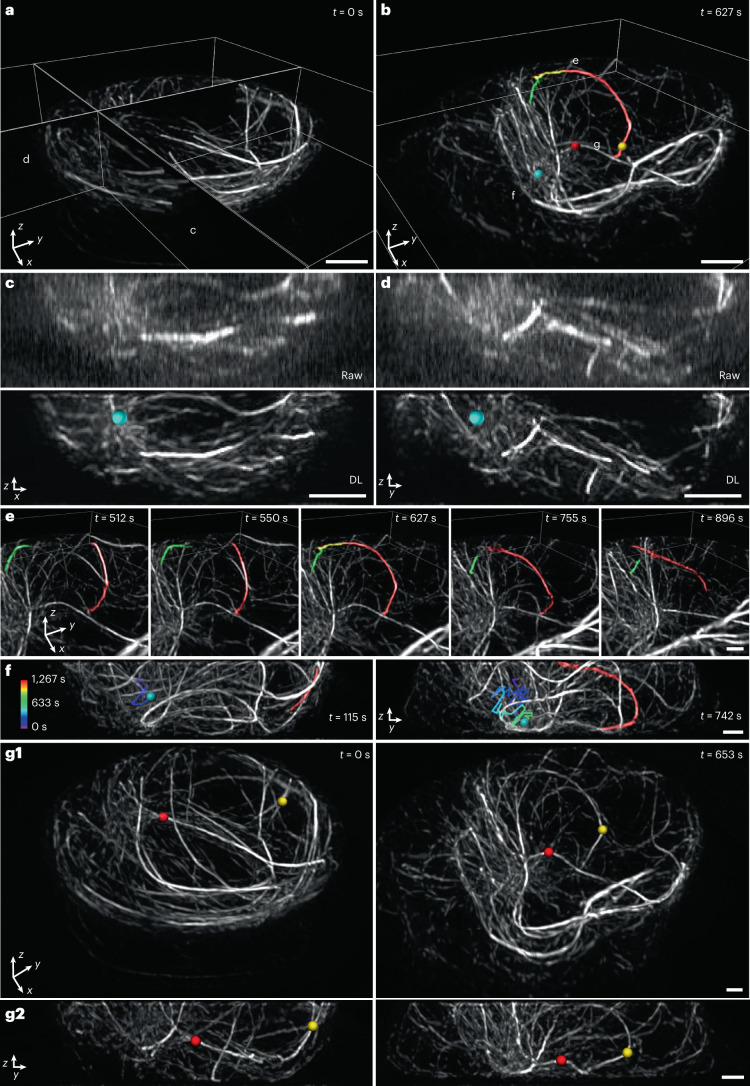
Fig. 6. Denoising and axial resolution enhancement unveil rich microtubule dynamics within a living immune cell.
a,b, Selected volumetric reconstructions of Jurkat T cells expressing EMTB 3× GFP are shown from 100-timepoint series (volumes recorded every 12.8 seconds) in perspective views. In b, the MTOC (cyan sphere), overlapping microtubules (red, yellow, green) and buckling microtubules (red and yellow spheres) are shown. c,d, Comparative axial views (maximum intensity projections over 2-µm thickness in y) of 3D SIM reconstructions (‘Raw’, upper row) and deep learning output (‘DL’, bottom row) corresponding to planes in a. Position of MTOC is indicated (cyan sphere). e, Selected timepoints corresponding to subregion marked in b, emphasizing two microtubule filaments that are initially separated (t = 512 seconds and 550 seconds), merge over the nucleus (t = 627 seconds) and separate again (t = 755 seconds and 896 seconds). See also Supplementary Video 13. f, Axial views (projections over 8-µm thickness) that emphasize correlated, inward movement of MTOC (cyan sphere; previous trajectory temporally coded as indicated in color bar) and microtubule filament (red; the same filament shown in b and e). See also Supplementary Video 14. g, Lateral (g1) and axial (g2) views emphasizing buckling of two microtubule filaments (red and yellow spheres, as shown in b). Pre-buckling: left columns; post-buckling: right columns. Both g1 and g2 are projections over 8-µm thickness. See also Supplementary Video 15. Scale bars, 2 µm (a–d) and 1 µm (e–g). DL, deep learning; s, seconds.

