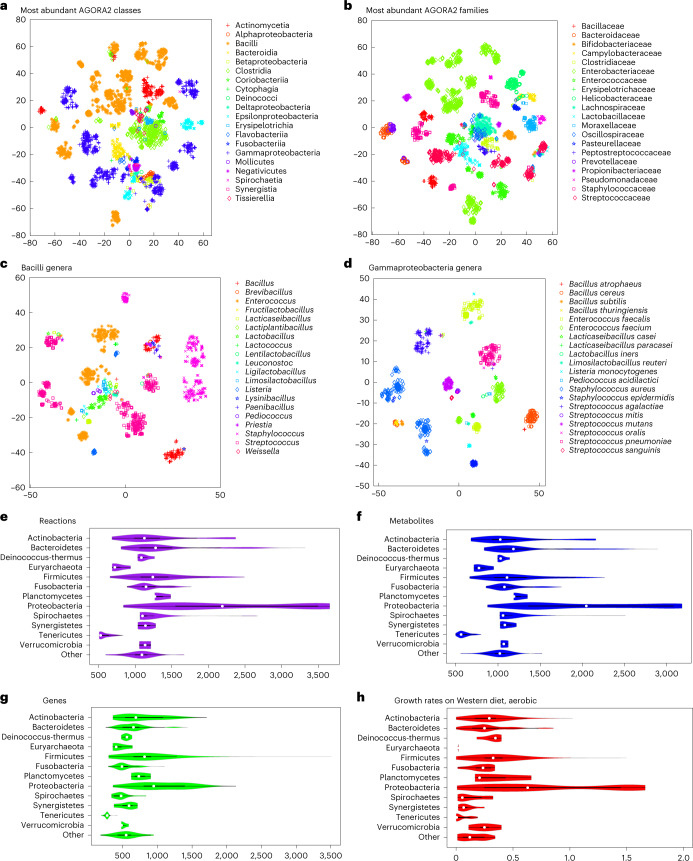
Fig. 2. Taxonomically related strains are similar in their AGORA2 reconstruction content.
a–d, Clustering through t-SNE52 of reaction presence across all pathways per reconstruction. Coordinates were statistically different across taxonomic units (Kruskal–Wallis test, P = 0.0001 in all cases). a, Members of the largest classes. b, Members of the largest families. c, Members of the Bacilli class by genus. d, Members of the Gammaproteobacteria class by genus. e–h, Features of all AGORA2 reconstructions across phyla: e, Number of reactions. f, Number of metabolites. g, Number of genes. h, growth rate in h−1 on aerobic Western diet.

