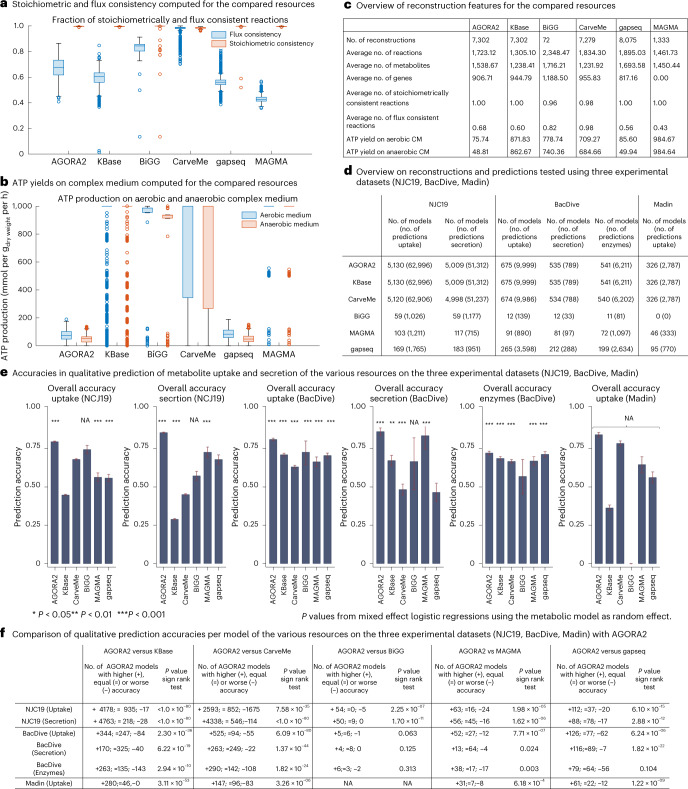
Fig. 3. Comparison of AGORA2-refined reconstructions, draft reconstructions and three other reconstructions resources.
Compared were the 7,302 AGORA2 and KBase draft reconstructions, 72 manually curated reconstructions from the BiGG database28, 5,587 reconstructions built through CarveMe15, 8,075 reconstructions built through gapseq18 and 1,333 MAGMA reconstructions17. a, Fraction of reactions that are stoichiometrically and flux consistent as defined in ref. 29 for each model derived from the five compared resources. Exchange and demand reactions, which are stoichiometrically inconsistent by definition, were excluded. b, Aerobic and anaerobic ATP production on complex medium (mmol per gdry weight per h) by each model derived from the five compared resources. c, Overview of reconstruction properties for the compared resources. d, Overview of number of models and number of predictions tested in validating AGORA2, KBase, BiGG, CarveMe, gapseq and MAGMA against three independent experimental datasets30,32,33. e, Bar plots with 95% confidence intervals of overall accuracies of the five resources in predicting uptake and secretion in the three experimental datasets. Significance of prediction accuracy was determined by mixed effect logistic regressions using the metabolic model as random effect variable to account for the statistical dependence of predictions stemming from the same model. NA indicates a missing P value due to empty categories (for example, no true negatives detected). f, Comparison of accuracies per model of the various resources on the three experimental datasets. P values were derived by sign rank tests.

