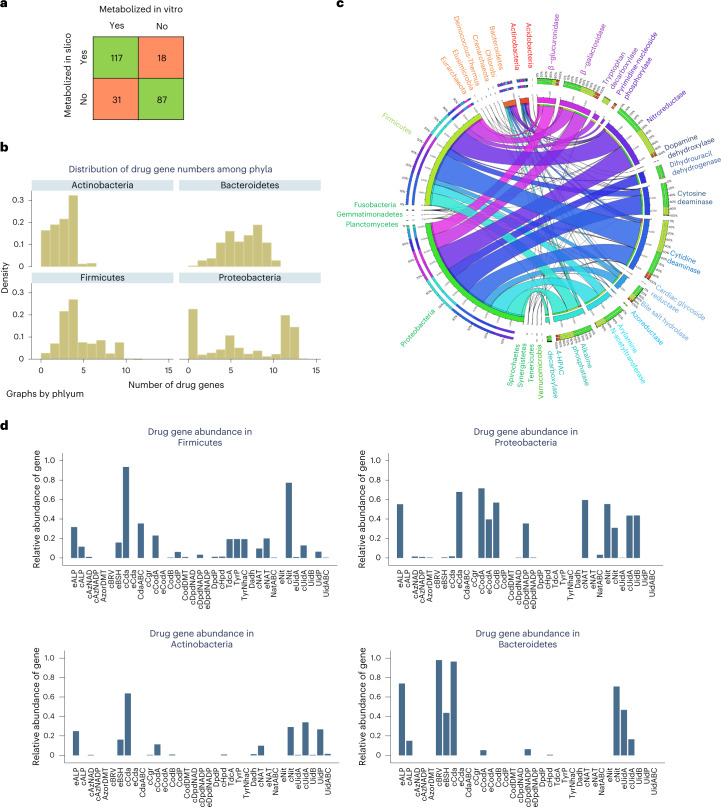
Fig. 4. Overview of reconstructed drugs and annotated drug enzymes present in AGORA2.
a, Overlap between independent, experimentally demonstrated activity of drug-metabolizing enzymes and predictions by models derived from the AGORA2 reconstructions for 253 drug–microbe pairs (Supplementary Table 7). b, Distribution of the number of strains carrying each drug enzyme over the 14 analyzed phyla. c, Fraction of strains carrying each gene encoding drug enzymes or transport proteins in the four main phyla in the human microbiome. d, Distribution of the number of drug genes per strain for the four main phyla. For the list of abbreviations, see Supplementary Table 3b.

