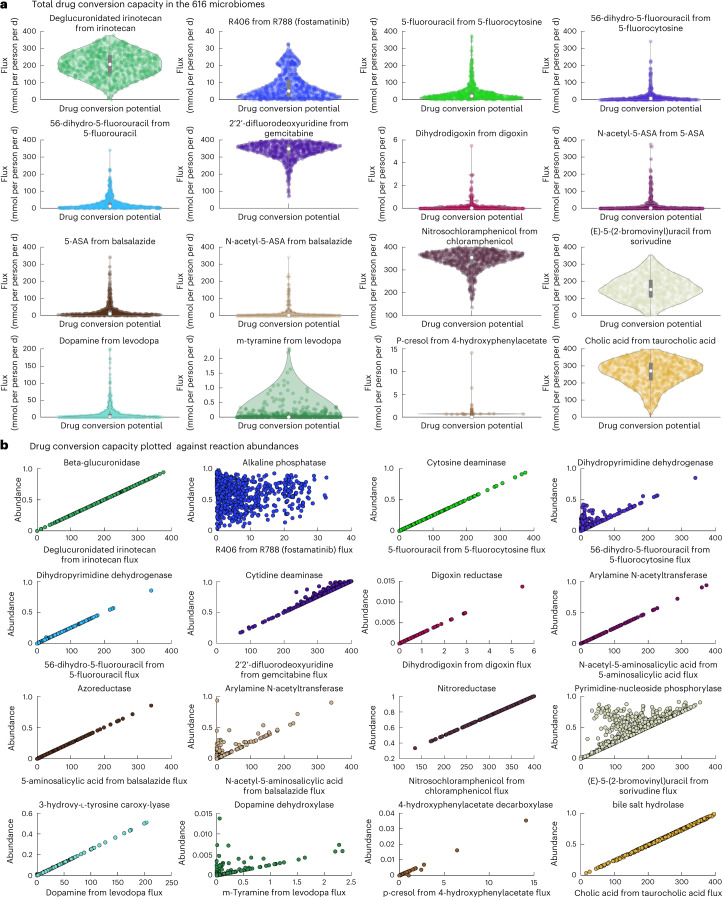
Fig. 5. Drug conversion capacity of 616 microbiomes.
a, Drug conversion potential in the microbiomes of 365 Japanese patients with CRC and 251 controls on the Average Japanese Diet. The violin plots show the distribution of drug metabolite flux in mmol per person per d. b, Drug conversion potential (mmol per person per d) plotted against the total relative abundance of the reaction producing the shown drug metabolite in the 616 microbiomes. See Supplementary Table 5a for a description of each drug-metabolizing enzyme.

