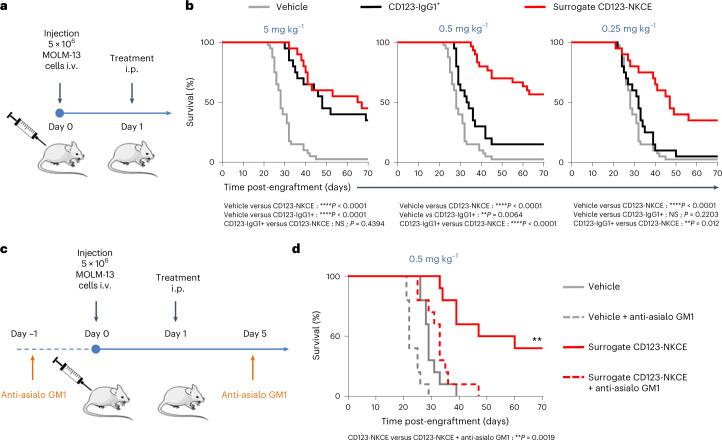
Fig. 4. CD123-NKCE promotes tumor growth control in vivo.
a, Schematic diagram of the experimental setting used in b. i.p., intraperitoneal. b, Mice engrafted with MOLM-13 cells i.v. were treated, on the day after cell injection, with 5 mg kg−1 (left panel), 0.5 mg kg−1 (middle panel) or 0.25 mg kg−1 (right panel) surrogate CD123-NKCE (red), anti-CD123 antibody (CD123-IgG1+; black), or vehicle (gray). Kaplan–Meier curves were plotted for the analysis of mouse survival. Endpoint significance was calculated in a log-rank test. n = 10 to 20 per group. *P < 0.05; **P < 0.01; ***P < 0.001;****P < 0.0001. NS, not significant. c, Schematic diagram of the experimental setting used in d. d, Mice were split into two groups, one treated with anti-asilo GM1 1 day before engraftment (day −1) and on day 5 to deplete NK cells, and the other left untreated. MOLM-13 cells were transplanted i.v. into the mice of the two groups on day 0, and the mice were then treated, the day after cell injection, with 0.5 mg kg−1 surrogate CD123-NKCE (red) or vehicle (gray). Kaplan–Meier curves were plotted to analyze mouse survival. Dashed lines correspond to the groups treated with anti-asialo GM1 antibody. Endpoint significance was calculated in a log-rank test. n = 10 per group. *P < 0.05; **P < 0.01; ***P < 0.001; ****P < 0.0001. NS, not significant.

