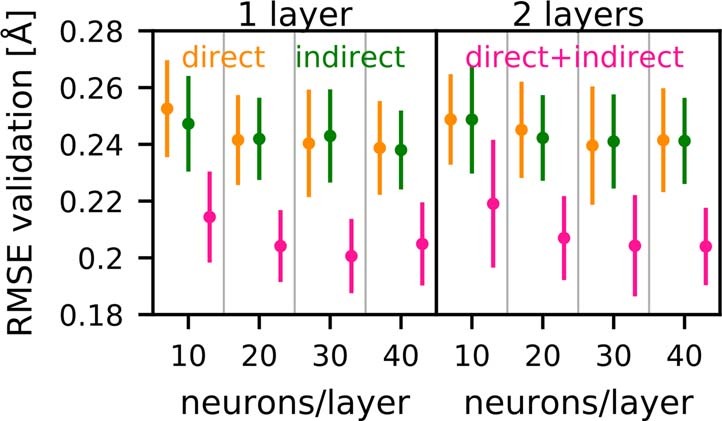
Extended Data Fig. 10. Testing of parameters of the neural network models.

For different numbers of layers and neurons per layer, the RMSE of predicted rmsd values relative to rmsd values obtained from the simulations for the cross-validation sets is shown. Mean (circles) and standard deviations (lines) obtained from training and cross-validation against 10 different training data sets. Colors denote different h-bond types used as input for the networks.
