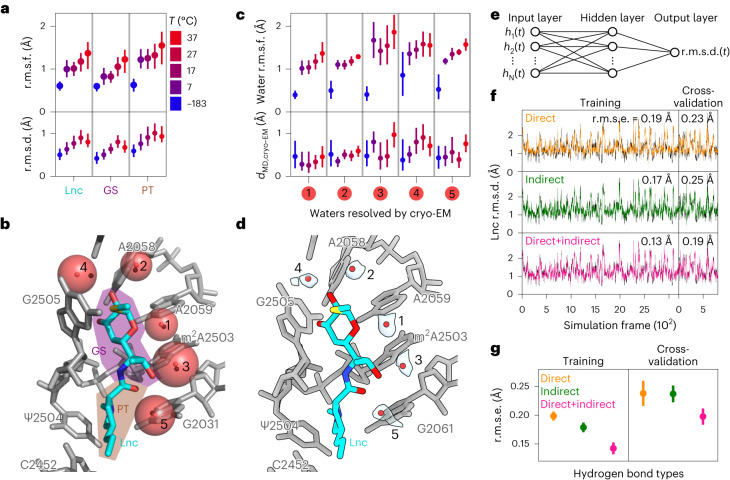
Fig. 5. Temperature-dependent dynamics of lincomycin and waters obtained from MD simulations.
a, Fluctuations of atom positions in simulations at different temperatures are quantified by r.m.s.f. for all lincomycin atoms (Lnc), for the galactopyranoside sugar (GS) and the propyl-pyrrolidinyl tail (PT). Structural deviations of average MD structures from cryo-EM structure are quantified by r.m.s.d. Circles and lines indicate median values and 95% confidence intervals obtained from ten independent simulations. b, Molecular model of lincomycin, surrounding rRNA nucleotides and waters (black spheres) within hydrogen bond distance resolved by cryo-EM. Average water positions (solid red spheres) and their r.m.s.f. (radius of transparent red spheres) obtained from MD simulations at 37 °C are shown. c, The r.m.s.f. for each water shown in b and distances between positions in cryo-EM and MD simulations. Median and confidence intervals as described in a. d, same view as b, but with cryo-EM density (transparent) shown for water molecules. e, Neural network to predict r.m.s.d. of lincomycin from occupancies of hydrogen bonds hn(t) f, The r.m.s.d. of lincomycin obtained from MD simulations (black lines) and predicted by neural networks trained on occupancies of direct, indirect or direct and indirect hydrogen bonds (colors). Data used for training and cross-validation are indicated. R.m.s.e. between r.m.s.d. values predicted from the neural network and obtained from simulation. g, Mean (circles) and standard deviations (lines) of r.m.s.e. for training and cross-validation for ten independent neural networks with different sets of training and cross-validation data.

