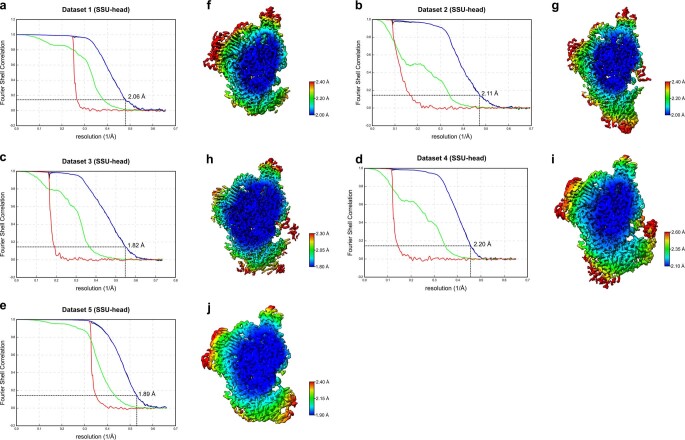
Extended Data Fig. 2. Resolution of antibiotic-SSU head maps.
a-e, Fourier-shell correlation (FSC) curve of the focused refined antibiotic-SSU head maps for (a) dataset 1, (b) dataset 2, (c) dataset 3, (d) dataset 4, and (e) dataset 5. The different curves include the masked map (green), unmasked map (blue) and the phase−randomized masked map (red). The dashed line at FSC 0.143 indicates that the average resolution for the SSU head maps for datasets 1–5 are 2.06 Å, 2.11 Å, 1.82 Å, 2.20 Å, 1.89 Å, respectively. f-j, Transverse section of the SSU head colored by local resolution for the focused refined maps calculated from (f) dataset 1, (g) dataset 2, (h) dataset 3, (i) dataset 4, and (j) dataset 5.

