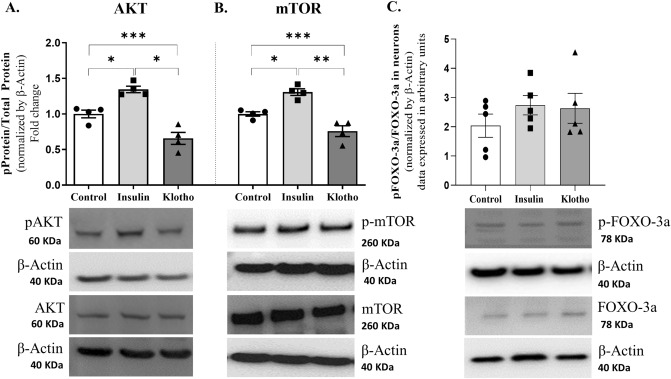
Figure 1.
Phosphorylation levels of AKT, mTOR, and FOXO3a after 24 h of treatment with insulin 100 nM or Klotho 1 nM in primary neuronal culture. (A) Statistical analysis indicated that insulin increases AKT phosphorylation on Ser473, while Klotho decreased AKT phosphorylation. One-way ANOVA followed by Tukey’s multiple comparisons tests; pAKT/AKT [F = 29.05; P = 0.0001; R squared: 0.8659]. (B) Statistical analysis of mTOR phosphorylation levels. One-way ANOVA followed by Tukey’s multiple comparisons tests indicated that insulin increased phosphor-mTOR, as expected, whereas Klotho decreased phospho-mTOR[F = 25.78; P = 0.0002; R squared = 0.8514]. (C) Statistical analysis of FOXO-3a phosphorylation levels. One-way ANOVA indicated the absence of significant difference [F = 0.8042; R squared = 0.1182, P = 0.4702]. Below the graphs are the representative bands of each group in western blot autoradiographs. The original autoradiographs are available in Supplementary Fig. S3. N = 4–5 independent cell cultures. *P < 0.05 and ***P = 0.0001.

