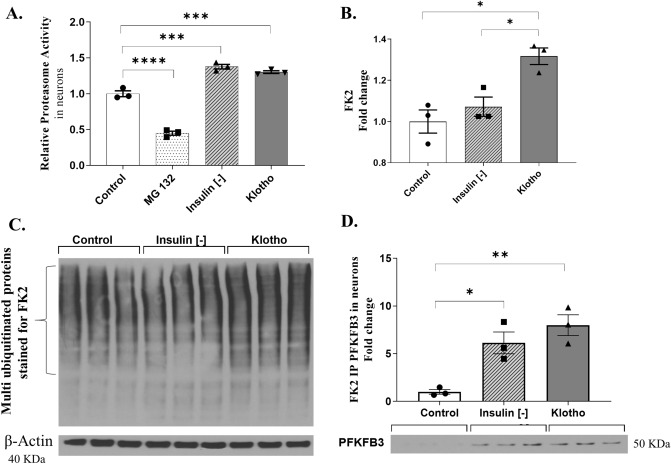
Figure 5.
Relative proteasome activity and levels of ubiquitination measured by immunoprecipitation in neurons. (A) For the measurement of proteasome activity, four groups were analyzed: the control group, a positive control group whose cells received a proteasome inhibitor (MG 132, 50 µM, for 2 h), the insulin-deprived group, and the group treated with Klotho. One-way ANOVA suggested a difference among groups [F = 180.5; R squared = 0.9854; P < 0.0001]. The post-test Tukey indicated that the group treated with the proteasome inhibitor MG132 had decreased proteasome activity compared to all the other groups [control vs. MG132: mean diff.: 0.5502; q = 17.55; P < 0.0001. MG132 vs. Insulin (−): mean diff: − 0.4498; q = 29.60; P < 0.0001. MG132 vs. Klotho: mean diff.: − 0.4498; q = 27.18, P < 0.0001]. Insulin deprivation increased proteasome activity compared to MG132 and control [insulin (−) vs. control: mean diff. − 0.3774; q = 12.04; P = 0.0001]. Klotho treatment increased proteasome activity compared to MG132 and control [Klotho vs. control: Mean diff: − 0.3016; q = 9.623, P = 0.0006]. N = 3 independent cellular cultures. Each dot in the graph represents an average of values measured in 22–24 wells of a 96-well plate from a single cell culture. (B) Western blot for antibody against polyubiquitin (FK2) proteins. Klotho treatment increases polyubiquitination compared to the control and insulin deprivation groups. One-way ANOVA followed by Tukey’s multiple comparisons tests [F = 11.91; R squared 0.7988; P = 0.0081]; N = 3 independent neuron culture. (C) Representative membrane of FK2 immunostaining. (D) Immunoprecipitation assay against clone FK2 followed by western blot against PFKFB3. Representative images of the western blot are below the graph. Results suggest that either insulin deprivation or Klotho treatment enabled increase in the PFKFB3 ubiquitination in neurons. One-way ANOVA [F = 15.39; R squared = 0.8369; P = 0.0043] followed by Tukey’s multiple comparisons tests [Insulin (-) vs. control: mean diff: − 5.137, q = 5.563, P = 0.0180] and [Klotho vs. control: mean diff: − 6.993, q = 7.573, P = 0.0042], N = 3 independent assays. Samples were obtained from pools of a 6-well plate (an average of 6 × 10⁶ cells). The original autoradiographs are available in Supplementary Fig. S7.

