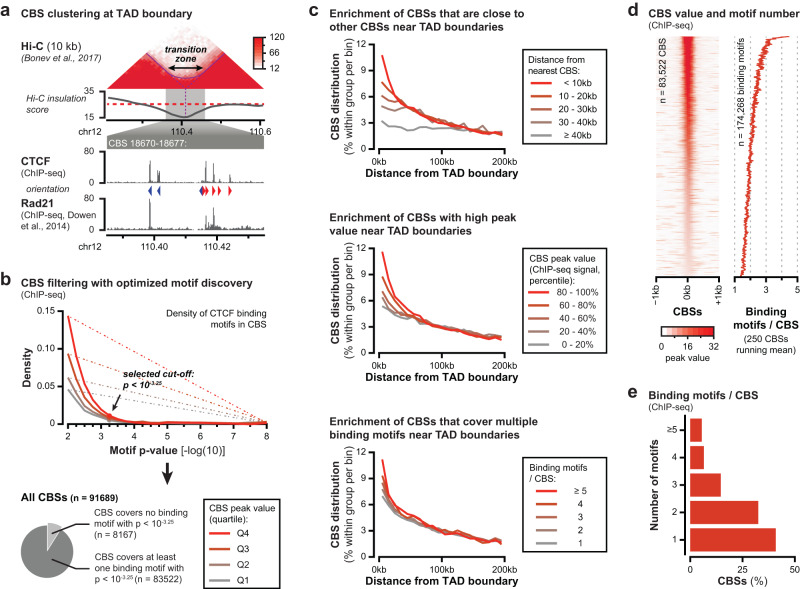
Fig. 1. Multiple features of CTCF binding are enriched around TAD boundaries.
a Top: TAD boundary in mouse embryonic stem cells (mESCs) that appears as an extended transition zone. Top: intersection of the dashed lines indicates the TAD boundary as called from the minimum in the insulation score, whereas the solid arch demarcates the strong Hi-C signal that indicates intermingling around the boundary. In-between: insulation score (red dashed line: cut-off used for TAD calling). Bottom: zoomed-in CTCF and Rad21 ChIP-seq data showing clustered CBSs within the transition zone. Arrowheads indicate the orientation of the most significant CTCF binding motif in the CBSs. b Filtering of CTCF ChIP-seq peaks based on optimal CTCF binding motif discovery. Optimal enrichment is determined based on the maximum distance from a linear increasing density (dotted lines). P-values refer to motif significance score as determined using the MEME-suite (see Methods section). c Three features of CBSs are enriched close to TAD boundaries in mESCs. Top: CBSs sorted on distance from their nearest CBS relative to TAD boundaries. Middle: CBSs sorted on peak values relative to TAD boundaries. Bottom: CBSs sorted on covered binding motifs relative to TAD boundaries. d Ranking of identified CBSs based on peak value (left) and the corresponding number of motifs (running mean). e Number of CTCF binding motifs within CBSs.

