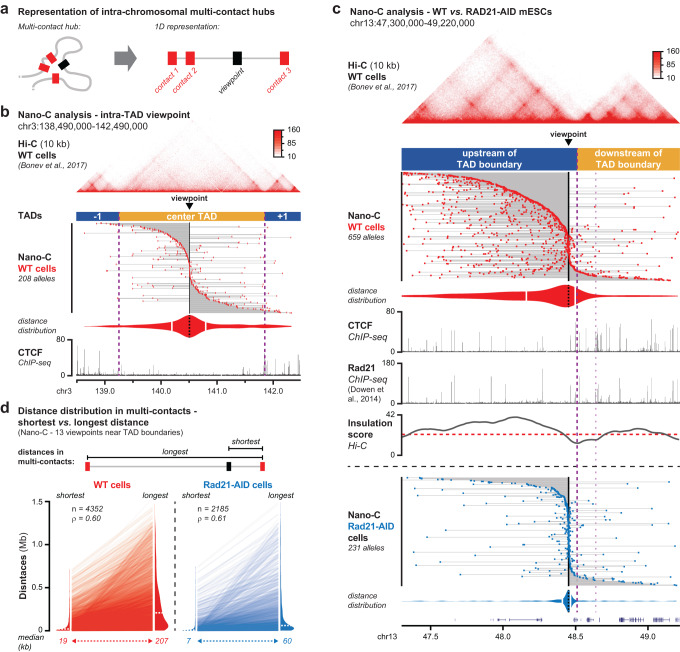
Fig. 4. Nano-C identifies and characterizes higher-order loops that structure TADs.
a 1D representation of multi-contacts. The Nano-C viewpoint is indicated with a black box and the identified contacts with red boxes. The gray line connects all contacts, thereby indicating the genomic interval that is spanned. b Nano-C multi-contacts in WT mESCs surrounding a central viewpoint within a large TAD with little CTCF binding. Violin plot indicates distances of up- and downstream interactions (white lines: median distances). Dashed purple lines indicate TAD boundaries. The viewpoint and Hi-C data are indicated on top. CTCF ChIP-seq data is indicated below. c Nano-C multi-contacts in 2 TADs surrounding a viewpoint that is close to a TAD boundary in WT (top, red) and Rad21-AID (bottom, blue) mESCs. Violin plots indicate distances of up- and downstream interactions of the viewpoint. The thick purple line indicates the boundary of interest and the thinner line a nearby boundary. Top: WT Hi-C data. In-between: WT CTCF and Rad21 ChIP-seq data, and Hi-C insulation score (red line: cut-off). d Shortest and longest distances within Nano-C multi-contacts in WT and Rad21-AID mESCs. Violin plots show the distance distributions for the combined 13 viewpoints (dashed white lines: median distance). Lines between violin plots connect pairs of shortest and longest distances within the same multi-contact. Number of data points and the Spearman correlation score are indicated in the top-left corner.

