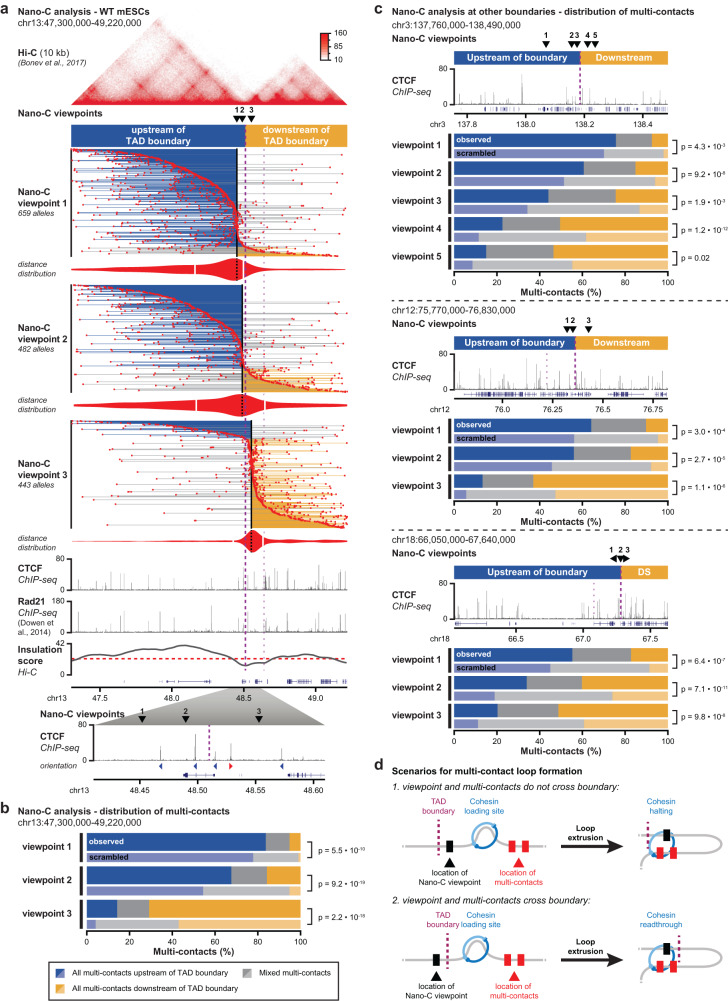
Fig. 5. Nano-C confirms the stepwise contribution of individual CBSs to loop extrusion blocking and TAD insulation.
a Nano-C multi-contacts for three viewpoints in 2 TADs surrounding a boundary in WT mESCs. The color of the lines that connect multi-contacts indicates if all interactions are upstream of the boundary (blue), downstream of the boundary (orange) or on both sides (gray). Violin plots indicate distances of up- and downstream interactions (white lines: median distances). Viewpoints and Hi-C data are indicated above. ChIP-seq data for CTCF and Rad21, and Hi-C insulation score (red line: cut-off) are depicted below. The thick purple line indicates the boundary of interest and the thinner line a nearby boundary. Below, a zoom-in of CTCF binding in the transition zone surrounding TAD boundary is provided. b Distribution of Nano-C multi-contacts in the surrounding TADs. Scrambled distributions of multi-contacts were obtained after randomly assigning contacts up- and downstream into multi-contacts. Significance: G-test of independence. c Distribution of Nano-C multi-contacts in the surrounding TADs for viewpoints close to three other boundaries. Above, the position of the viewpoints and CTCF binding is indicated. Significance: G-test of independence. d Scenarios of Cohesin loading (left) and extruded loops (right) to explain multi-contacts that do not cross a TAD boundary (top) and that cross a TAD boundary (bottom, involving Cohesin readthrough). Nano-C viewpoints are indicated as black boxes and multi-contacts as red boxes.

