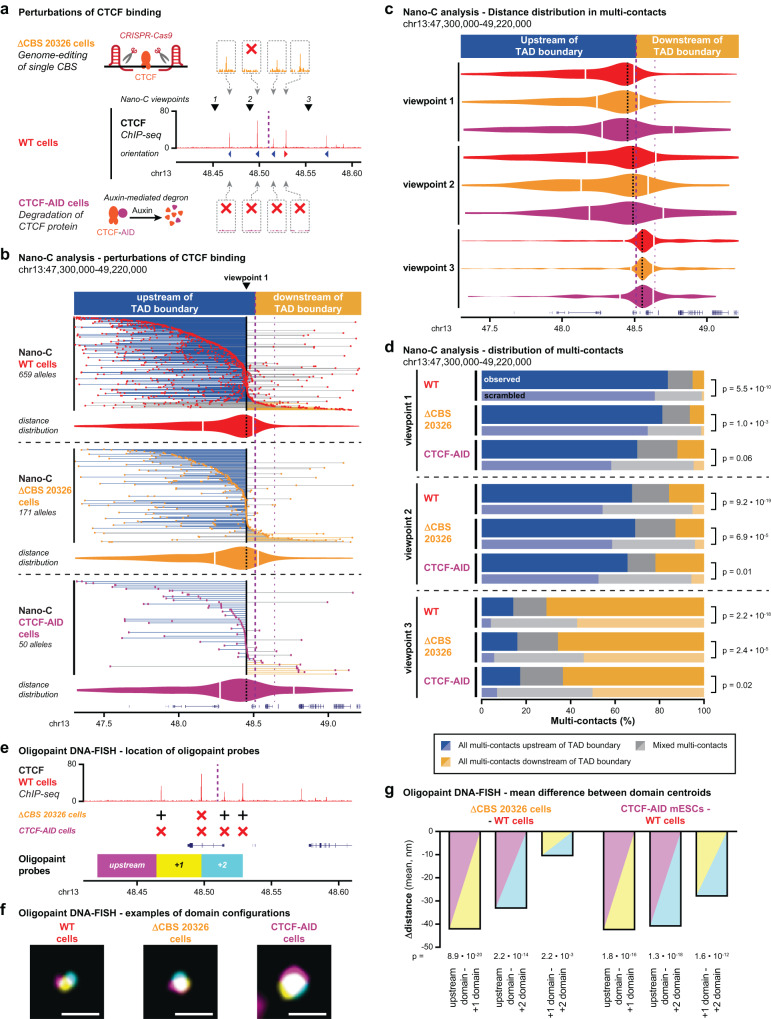
Fig. 6. Impact of CBS perturbations on loop extrusion blocking and TAD insulation.
a Overview of CTCF binding perturbations. Middle: CTCF binding (ChIP-seq) 100 kb up- and downstream of the TAD boundary in WT mESCs. Nano-C viewpoints (arrowheads) and the boundary (purple dashed line) are indicated as well. Above: CTCF binding (ChIP-seq) in the 5 kb surrounding the 4 CBSs directly surrounding the boundary in ΔCBS 20326 mESCs, where a single CBS is removed. Below, CTCF binding (ChIP-seq) surrounding the 4 CBSs in CTCF-AID mESCs, where CTCF is degraded after auxin treatment. Red crosses indicate absence of peaks. b Nano-C multi-contacts for a viewpoint in 2 TADs surrounding a boundary in WT, ΔCBS 20326 and CTCF-AID mESCs. The color of the lines indicates if all interactions are upstream of the boundary (blue), downstream of the boundary (orange) or on both sides (gray). Violin plots indicate distances of up- and downstream interactions of the viewpoint (white lines: median distances). The viewpoint is indicated above. The thick purple line indicates the boundary of interest and the thinner line a nearby boundary. c Distribution of Nano-C multi-contacts in the surrounding TADs in WT, ΔCBS 20326 and CTCF-AID cells (color-coding as in Fig. 6a). Violin plots indicate distances of up- and downstream interactions of the viewpoint. d Distribution of Nano-C multi-contacts in the surrounding TADs in WT, ΔCBS 20326 and CTCF-AID mESCs. Scrambled distributions of multi-contacts were obtained after randomly assigning contacts up- and downstream into multi-contacts. Significance: G-test of independence. e Setup of Oligopaint DNA-FISH analysis, with domains covered by probes indicated relative to CTCF binding. Crosses indicate the presence (black cross) or absence (red cross) of CTCF binding in ΔCBS 20326 and CTCF-AID mESCs. f Representative Oligopaint DNA-FISH images for the three mESC lines. Scale bar = 1 μm. g Difference in mean minimum distance between domain centroids for ΔCBS 20326 and CTCF-AID cells relative to WT cells. Shading refers to the pairs of domains that are analyzed. Significance: two-tailed Mann–Whitney test on pairwise distance distributions.

