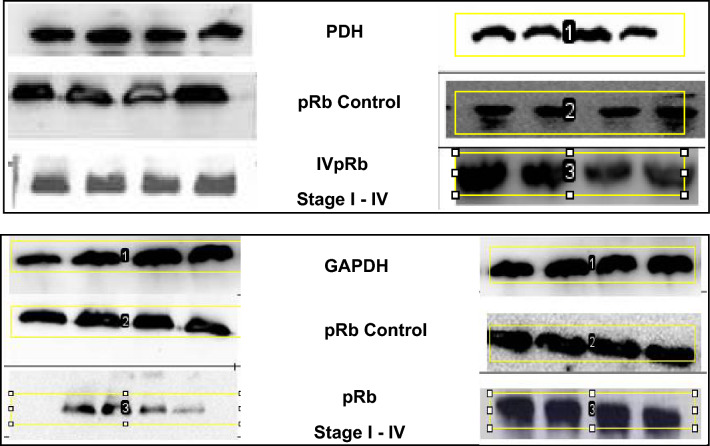
Figure 3.
Western blot images of the expression level of pRb protein normalized with GAPDH protein. Each group has four control samples (2nd Rows) and four cancerous samples of stages I to IV (3rd rows). Densitometric analysis of the bands showed higher expression of pRb in early stages (I and II) compared to advanced stages (III and IV) of cervical cancer. (The images are cropped. For complete images please see the supplementary data).

