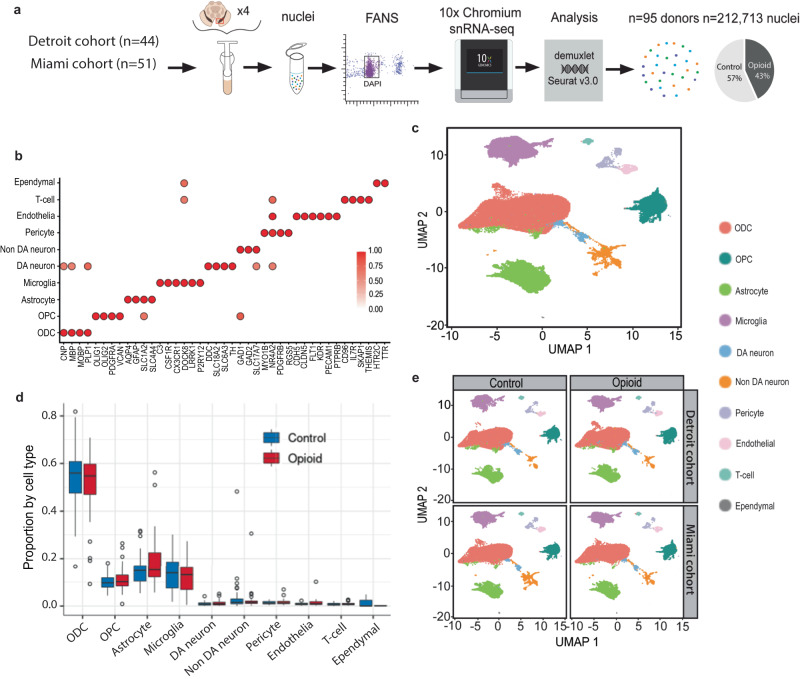
Fig. 1. Consistent proportions of VM cell types across specimen collection sites and cohorts.
a Experimental design and workflow for N = 95 VM samples, including collection at two different geographical areas, pooling of 3–4 VM specimens, nuclei purification by FACS, and 10x chromium snRNA-seq pipeline and genetic demultiplexing yielding a total of 212,713 nuclei. b Marker gene expression for each of the 10 glial and neuronal subpopulations as indicated. DA, dopaminergic neuron; non-DA, non-dopaminergic neurons; ODC, oligodendrocyte; OPC, oligodendrocyte precursor cell. Color represents the ratio of average gene expression across cells in the cell type relative to maximum in the most highly enriched cell type. c Uniform Manifold Approximation and Projection (UMAP) plot showing the identified 10 major cell types by cluster, as indicated, for total collection of n = 212,713 nuclei. d Box-and-whisker representation of the proportion of the 10 major cell types in each individual (box represents the first quartile, the median, and third quartile, while the whisker spans the 1.5x interquartile range of the first and third quartile); split by diagnosis as indicated red, opioid-related death and blue, control. e VM cell type composition by UMAP plot, shown for diseased and control individuals separately for each of the two collection sites. a–e N = 95 samples, Source data are provided as a Source Data file.

