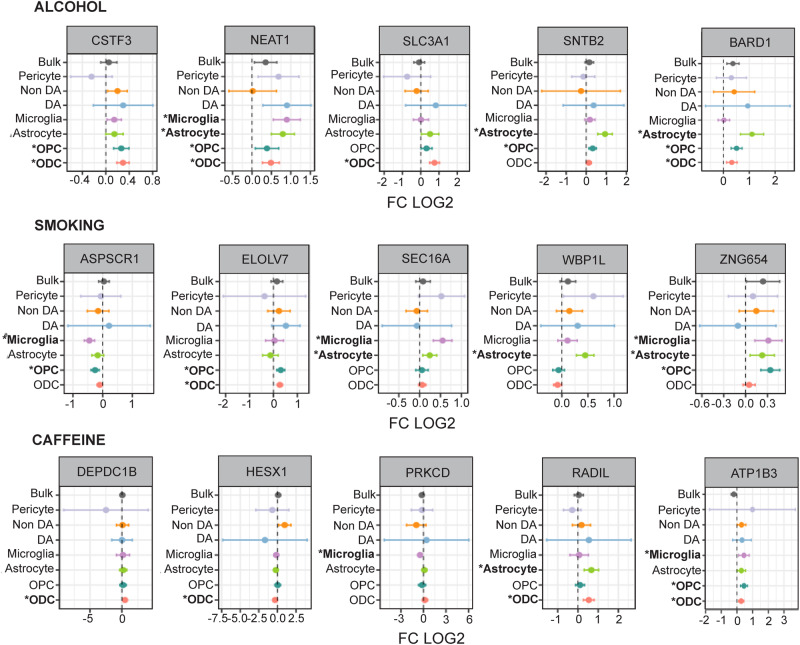
Fig. 5. Differentially expressed genes in the VM of opioid users linked to substance use in the general human population.
Forest plots of selected DEGs (FDR P < 0.1) in opioid-exposed VM (x axis log fold change compared to control, y-axis VM bulk tissue and single nuclei by cell-type RNA-seq) that are linked to alcohol and caffeine consumption, and smoking in PhenomeX database. Bars represent 95% confidence interval (LFC + /−1.96 S.E.). * bold font marks P value from DESeq2 (Wald test following chi-squared distribution with 1 degree of freedom), FDR (Benjamini–Hochberg) P < 0.1. See also Data S7. N = 95 samples (brain donors). Source data are provided as a Source Data file.

