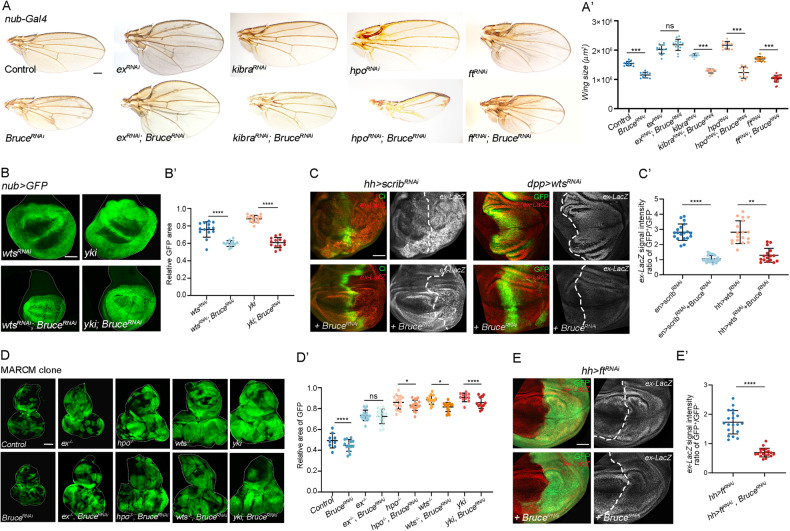
Fig. 2. Bruce acts upstream of Ex but in parallel with Hpo-Wts cascade.
A Light micrographs of adult wings bearing indicated genotypes are shown. Quantification of wing size (A’), n = 12, 12, 14, 14, 16, 18, 11, 11, 15, 23 (from left to right). B GFP labeled wing pouch regions with indicated genotypes are shown. Quantification of relative GFP region size (B’), n = 14, 13, 15, 13 (from left to right). C Wing pouch regions from larvae with indicated genotypes stained for expression of ex-lacZ. Quantification of relative ex-lacZ intensity (C’), n = 19, 22, 18, 16 (from left to right). D Eye-antennal discs of ey-Flp-MARCM-induced GFP positive mosaics clones with indicated genotypes. Quantification of clone size was shown in (D’), n = 9, 13, 16, 16, 18, 18 15, 15, 11, 12 (from left to right). E Wing pouch regions from larvae with indicated genotypes stained for expression of ex-lacZ. Quantification of relative ex-lacZ intensity (E’), n = 15, 14 (from left to right). Mean ± SD, n.s. not significant; *p < 0.05, **p < 0.01, ****p < 0.0001; two-tailed Student’s t tests (E’) or ordinary one-way ANOVA tests (A’, B’, C’, and D’). Scale bars: 200 μm for (A), 100 μm for (B, D); 50 μm for (E).

