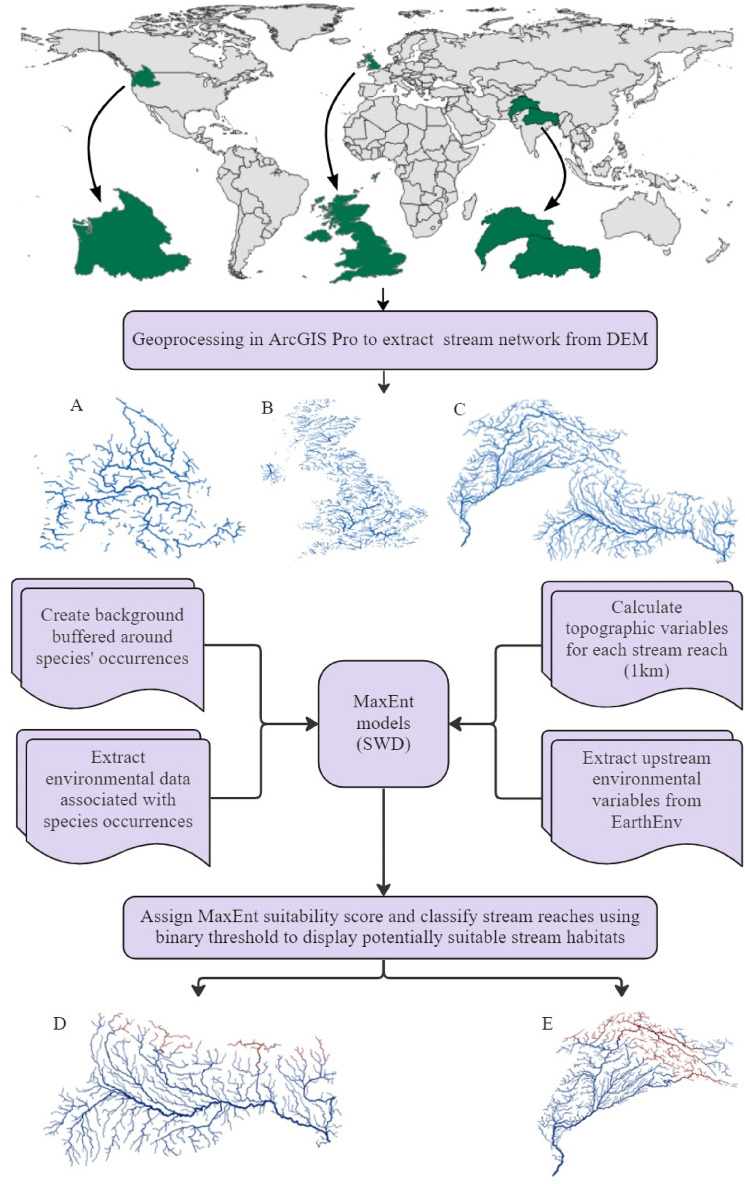
Figure 2.
Workflow diagram of data and processes used to develop MaxEnt models of suitable habitats for native and non-native fishes. Stream networks were extracted in ArcGIS Pro, MaxEnt models were built in R, and outputs were visualized back in ArcGIS Pro using appropriate binarization threshold. The geographic regions on the top shows regions of calibration (A-Columbia Basin for rainbow trout, B-United Kingdom for brown trout, C-Himalayan range for snow trout species), whereas stream network at the bottom represent receiving basins (D-Ganges River basin, E-Indus River basin). The figure was produced with ArcGIS Pro 3.0.0 with extensions provided by Oregon State University (https://www.esri.com/en-us/arcgis/products/arcgis-pro/overview).

