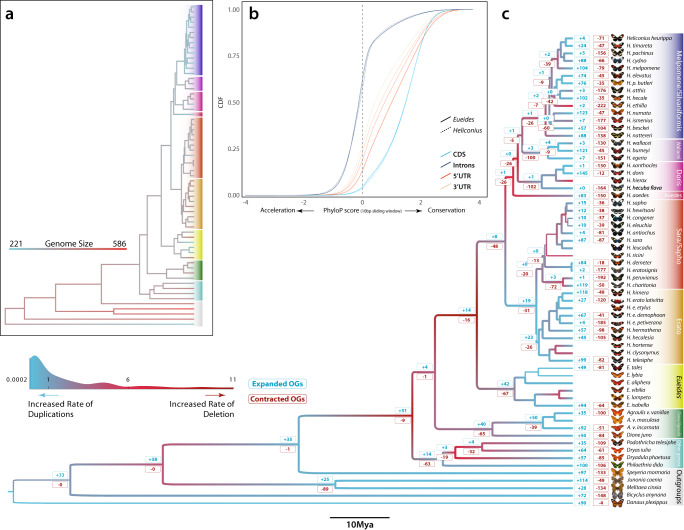
Fig. 3. Genomic dynamics, acceleration/conservation rates and ortholog copy number evolution.
a Ancestral genome size reconstruction of Nymphalids inferred by ML approach. b Cumulative distribution functions (CDFs) of scores for selected annotation classes (CDS, introns, 5’ and 3’ UTRs) as computed by the subtree scores for Eueides and Heliconius clades. PhyloP scores at sites of different annotation classes, based on the LRT method and multiple whole 63-species genome alignment. Positive scores indicate conservation, and negative scores indicate acceleration (CONACC mode) in a 10-bp sliding window. c Branch colors indicate the ratio between the rate of duplications (duplicated Mb/Mya per branch) and deletions (deleted Mb/Mya per branch) across the Nymphalid phylogeny. In general, red shifts indicate an increased rate of deletion over rate of duplication; the opposite is true for blue shifts. Numbers at nodes correspond to the amount of expanded (blue) and contracted (red) ortholog groups (values are shown for main branches and most complete genomes, see Methods).

