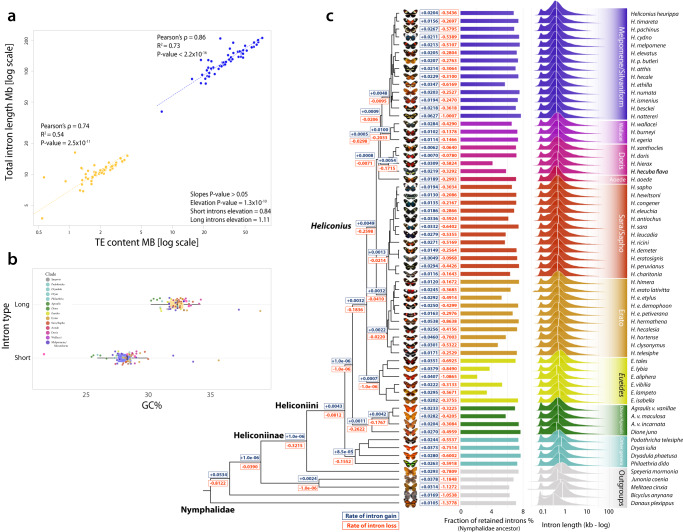
Fig. 4. Composition and intronic evolution.
a Log-log scatter plot showing high correlation between intron length and Transposable Element (TE) abundance. The significantly higher elevation of longer introns compared with short introns, indicates that large introns are more affected by TEs; short intron elevation = 0.84; P value ≤ 2.5 × 10⁻¹¹; long intron elevation = 1.11; P value = 2.2 × 10⁻¹⁶ using standardized major axis (SMA) regression test P value ≤ 1.3 × 10⁻¹⁰. b Box plot of GC content and intron size (One-sided Wilcoxon rank-sum test P value < 2.2 × 10⁻¹⁶), bars indicate the interquartile ranges (IQR), while whiskers the quartile (Q) ± 1.5*IQR. c Rates of intron gain (blue) and loss (red) across Nymphalid phylogeny, and fraction of retained introns from the Nymphalid ancestor. On the far left, the log scale distributions of intron lengths, white vertical bars indicate the median values.

