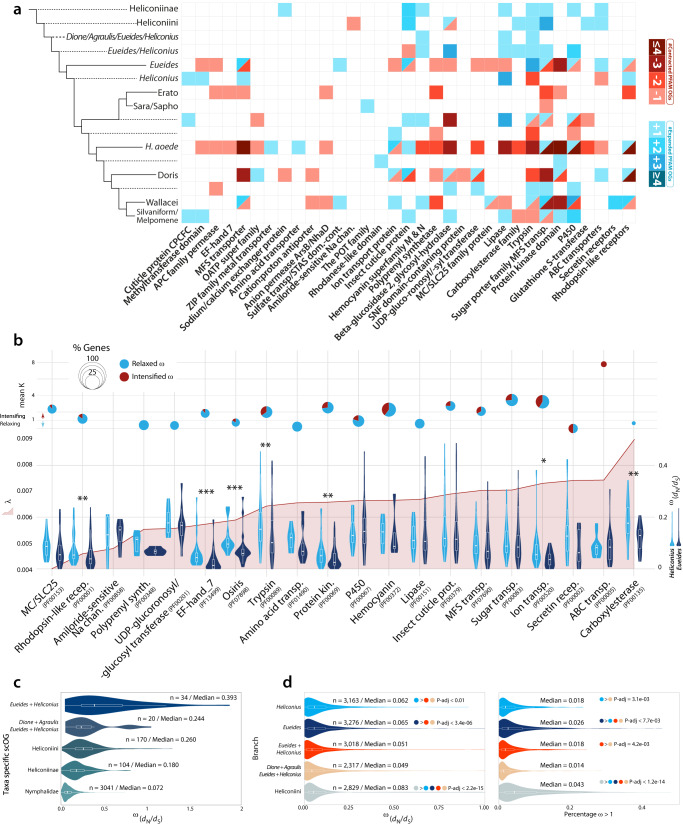
Fig. 5. Differential evolutionary rates gene families and scOGs across Heliconiini butterflies.
a Heatmap showing the different expansions and contractions in multiple gene families. Several gene families have been contracted in H. aoede. b Plots showing different evolutionary features of some of the analyzed gene families (minimum of 3 genes in Eueides spp. and Heliconius spp.). At the top section, dynamic pie charts showing mean K value (selection intensifier parameter). Values below one indicates a relaxation, while above one indicates intensification towards diversifying positive selection. The size of the pie charts indicates the fraction of genes under intensification (red) and relaxation (blue), and it is scaled according to the proportion of genes for which K was significantly different from H0 (No difference) (see Methods). For different gene families the panel below shows the gene turnover rate (λ) (left y-axis); right y-axis shows the distributions of mean ω for near-scOGs (see Methods) in Eueides and Heliconius (right y-axis). Asterisks indicate significant shifts between Eueides and Heliconius (One-sided Wilcoxon rank-sum tests; *≤0.05; **≤0.01; ***≤0.001). c Violin plot showing the distributions of mean ω rates (dN/dS) in scOGs according to their lineage-specificity (one-sided Wilcoxon rank-sum test, P-value < 0.05). d Distribution of mean ω rates (left) for scOGs on six branches of Heliconiini, and the proportion of genes for which ω is higher than one (right) (one-sided Wilcoxon rank-sum test, P adjusted values ≤ 0.05). For all plots boxplots within the violin plots bars indicate the interquartile ranges (IQR), while whiskers the quartile (Q) ± 1.5*IQR.

