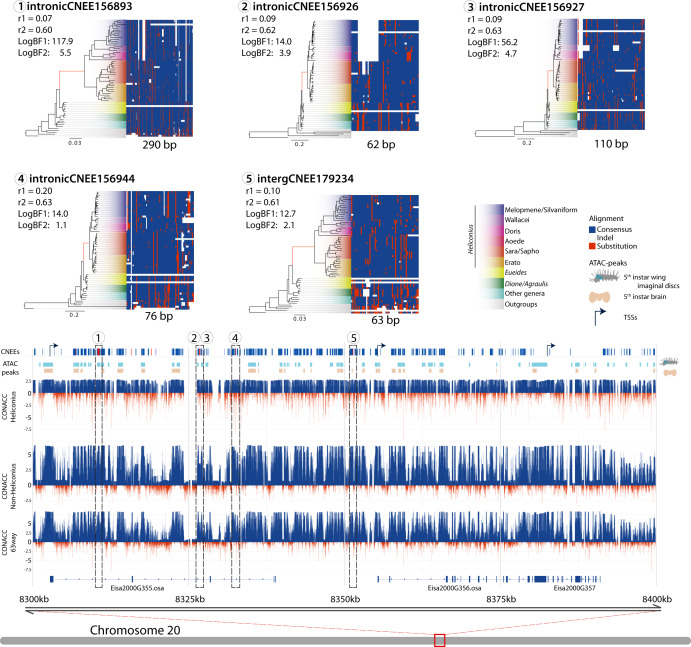
Fig. 6. Chromosome 20 enriched genomic window.
Diagram showing the distribution of CNEEs in one of 100 kb enriched window across the reference genome of E. isabella. From the bottom-up, the figure shows three genes, two of them homologs of the Drosophila osa. Above that are the CONACC scores obtained from the full alignment (63 species), for only the non-Heliconius species, and only the Heliconius species. In red the negative values indicate the acceleration of a given position of the alignment, and in blue the positive values indicate conservation. Above that are the ATAC peak distributions of two tissues from 5th larva instar, brain (in brown) and imaginal disc (in aquamarine), shown alongside the distribution of CNEEs in the region in dark blue with the eight aCNEEs. Numbers indicate the five aCNEEs selected as examples of the Heliconius aCNEEs, which are expanded at the top of the figure. In these examples, the alignments show conserved (nucleotides similar to the consensus, in blue) and accelerated sequences (nucleotides that differ from the consensus, in red). For each of the five aCNEEs the species phylogeny of the Nymphalids is shown where the branch lengths indicate the acceleration of the evolutionary rate for each given aCNEE. The branch that corresponds to the Heliconius stem is in red. For each aCNEE the two log-BFs and conserved (r1) and accelerated rate (r2).

