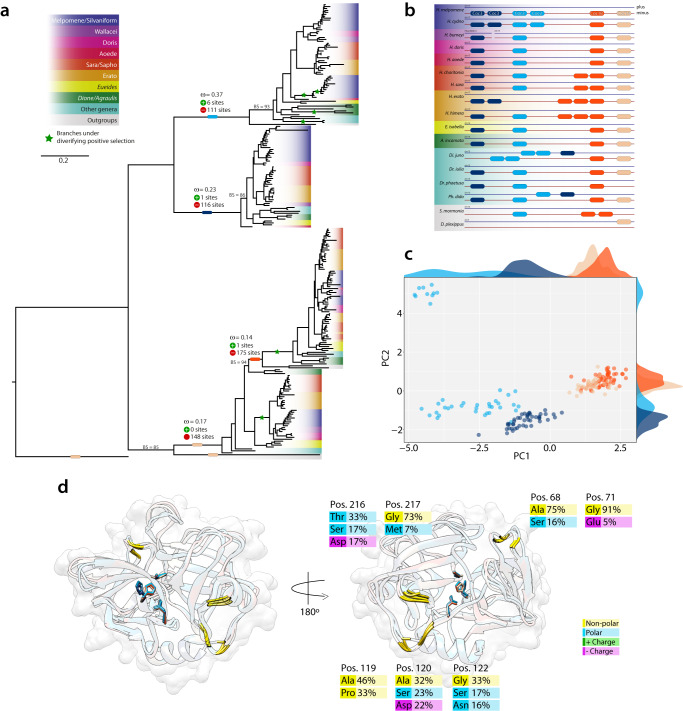
Fig. 7. Cocoonase evolution and structural divergence across Heliconiini.
a Maximum likelihood phylogeny of nucleotide sequences of the four cocoonase loci across Heliconiinae. Colored blocks on branches show the stem for each locus. The green star indicates branch under diversifying positive selection. Bootstrap (BS) values for main branches are listed for those with values below 95. b Synteny map of the different loci for the genomes with highest contiguity. c PCA of the network-based analysis of 181 predicted protein models. d Structural alignment of the closest sequence to the centroid of each of the five clusters of the PCA (colored ribbons). For each of structure the three active sites of the active cleft are depicted as sticks, while in gold the seven identified positions the best explains the clustering of the PCA. On the left the same structure rotated 180°. For each of the positions the most frequent amino acids are shown with their respective frequency in the alignment.

