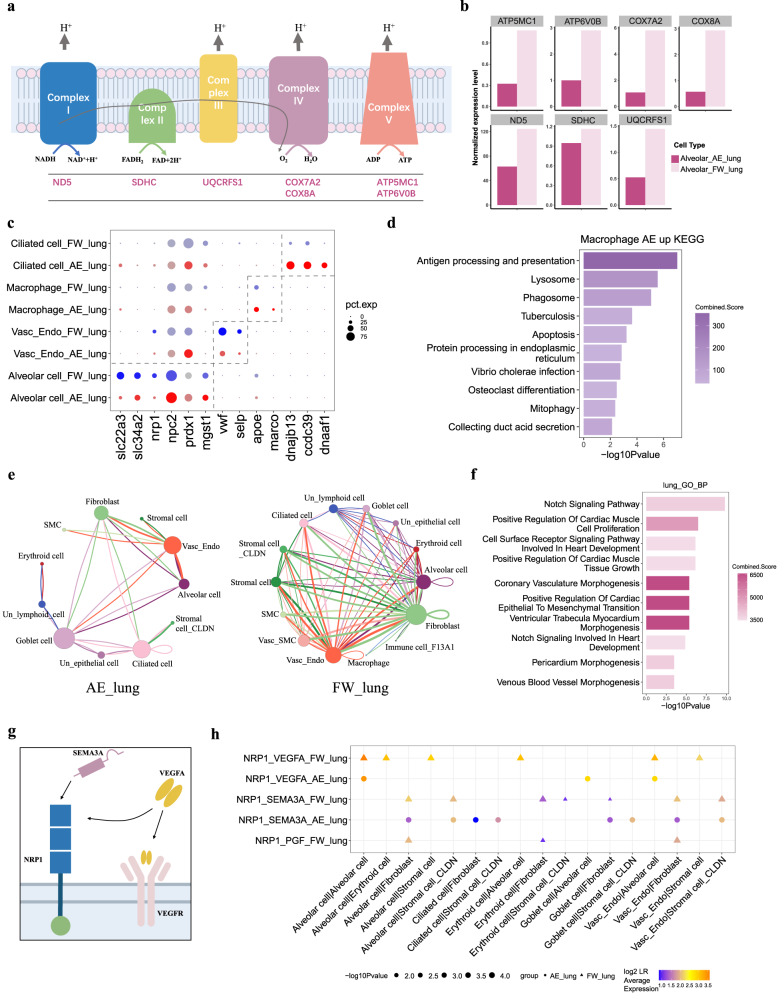
Fig. 2. Cellular and molecular features of lungfish lungs during terrestrialization.
a Schematics of the electron transport chain with differentially expressed genes (DEGs) in lung alveolar epithelial cells indicated. b The average expression levels of DEGs (see a) in alveolar cells during terrestrialization (AE; in maroon) and in freshwater (FW; in salmon) by bar plot. c Comparisons of selected DEGs between freshwater and terrestrialized lung cell types by bubble plot. AE denotes terrestrialization (red bubbles); FW, freshwater (blue bubbles). Circle size reflects the percentage of cells within a cell type which express the specific genes. d Enriched KEGG pathway of AE macrophage up regulated DEGs. The enrichment analysis was generated via the Enrichr web server using Fisher exact test, and the Benjamini-Hochberg (BH) was used for correction for multiple hypotheses testing. P values are indicated on the x-axis. e Comparison of cellular interactions among all cell types in terrestrialized lungfish lung (AE_lung, left) and freshwater lungfish lung (FW_lung, right) by net plots. Each node represents a kind of cell type, links mean the legend-receptor interactions and the width of link is in direct proportion to the LR pair numbers. f Enriched biological processes of LR pairs in the lungfish lung. Generated using the Enrichr web server. Annotated as in Fig. 2d. g Schematics of the transmembrane coreceptor NRP1 and its ligands VEGF and SEMA3A. h The expression of selected LR pairs in lung cell types from freshwater (FW) and terrestrialized (AE) lungfish. Circle (AE) or triangle (FW) size reflects the percentage of cells within a cell type which express the specific genes. The color of circles/triangles indicates the average expression of the LR pair. P values were calculated by CellphoneDB, which means the likelihood of cell-type specificity of a given receptor–ligand pairs. Source data are provided as a Source Data file.

