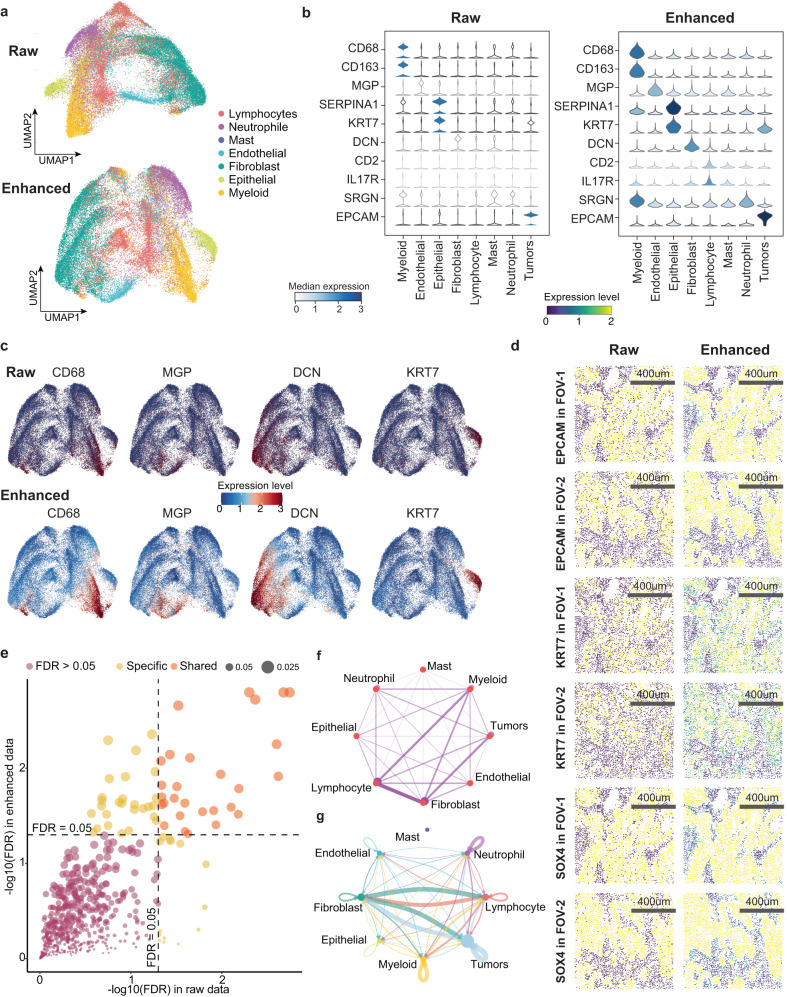
Fig. 3. SiGra enhances gene expression patterns that distinguish intratumoral spatial heterogeneity.
a UMAP visualizations of raw data and the enhanced data of the nontumor cell population. b Violin plots of the raw expression and the enhanced expression of marker genes in different cell populations (endothelial: 4272; epithelial: 3458; fibroblast: 13,368; lymphocyte: 11,664; mast: 287; M-cell: 7560; neutrophil: 5731; tumors: 37,281). c UMAP visualization of the raw expression and the enhanced expression of marker genes (CD68, MGP, DCN, KRT7). d Spatial visualization of the raw expression and the enhanced expression of tumour-related genes (EPCAM, KRT7, SOX4) in two FOVs. e Scatter plot of significantly associated ligand‒receptor (L-R) pairs in the raw data and the enhanced data. Orange- and yellow-coloured dots represent the shared and specific L-R pairs, respectively. Source data are provided as a Source Data file. f Network representation of the weighted adjacent cell types. The edge width represents the adjacency between two cell types. g Adjacent cell communications considering both neighbouring cell weights and L-R interaction strength.

