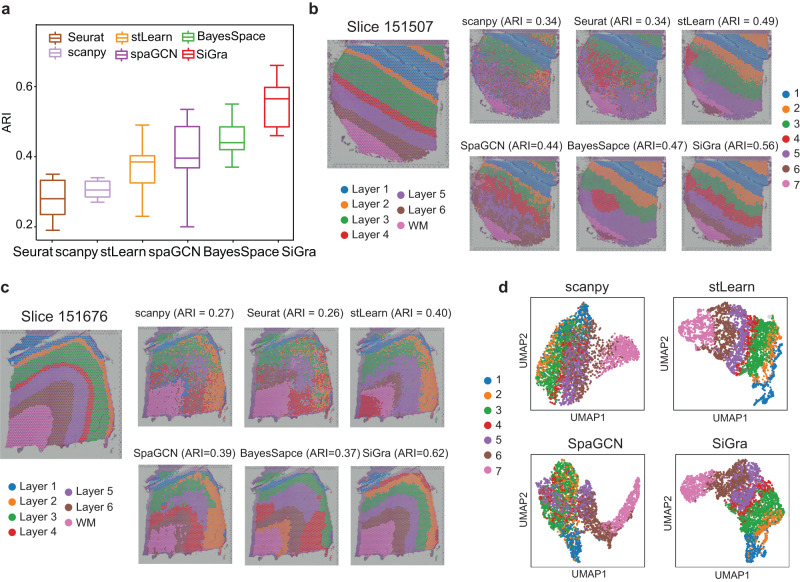
Fig. 5. SiGra improves the identification of known layers in brain tissues.
a Boxplot of the adjusted Rand index (ARI) scores of six methods in all 12 DLPFC slices. In the boxplot, the centreline, box limits and whiskers denote the median, upper and lower quartiles, and 1.5× interquartile range, respectively. Source data are provided as a Source Data file. b Spatial domains detected by different methods, including Scanpy, Seurat, stLearn, BayesSpace, SpaGCN, and SiGra, in DLPFC slice 151507. c Spatial domains detected by different methods, including Scanpy, Seurat, stLearn, BayesSpace, SpaGCN, and SiGra, in DLPFC slice 151676. d UMAP visualizations of latent embeddings generated by Scanpy, stLearn, SpaGCN, and SiGra in DLPFC slice 151676. SpaGCN and BayesSpace are not shown because they did not provide latent embeddings for UMAP visualization.

