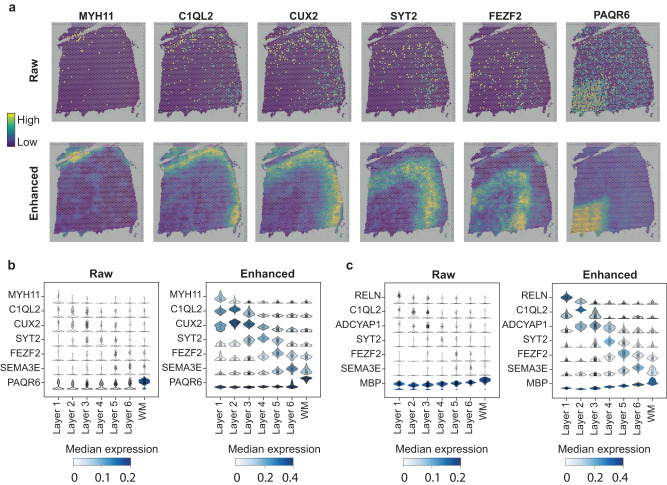
Fig. 6. SiGra improves spatial gene expression for better structural characterization.
a Spatial visualization of the raw expression and the enhanced expression of marker genes (MYH11, C1QL2, CUX2, SYT2, FEZF2, PAQR6) in DLPFC slice 151676. Numbers of spots in each layer: Layer 1: 289; Layer 2: 254; Layer 3: 836; Layer 4: 254; Layer 5: 649; Layer 6: 616; WM: 533. b Violin plots of the raw expression and the enhanced expression of marker genes in DLPFC slice 151676. c Violin plots of the raw expression and the enhanced expression of marker genes in DLPFC slice 151,507. Numbers of spots in each layer: Layer 1: 817; Layer 2: 305; Layer 3: 1,215; Layer 4: 369; Layer 5: 675; Layer 6: 486; WM: 354.

