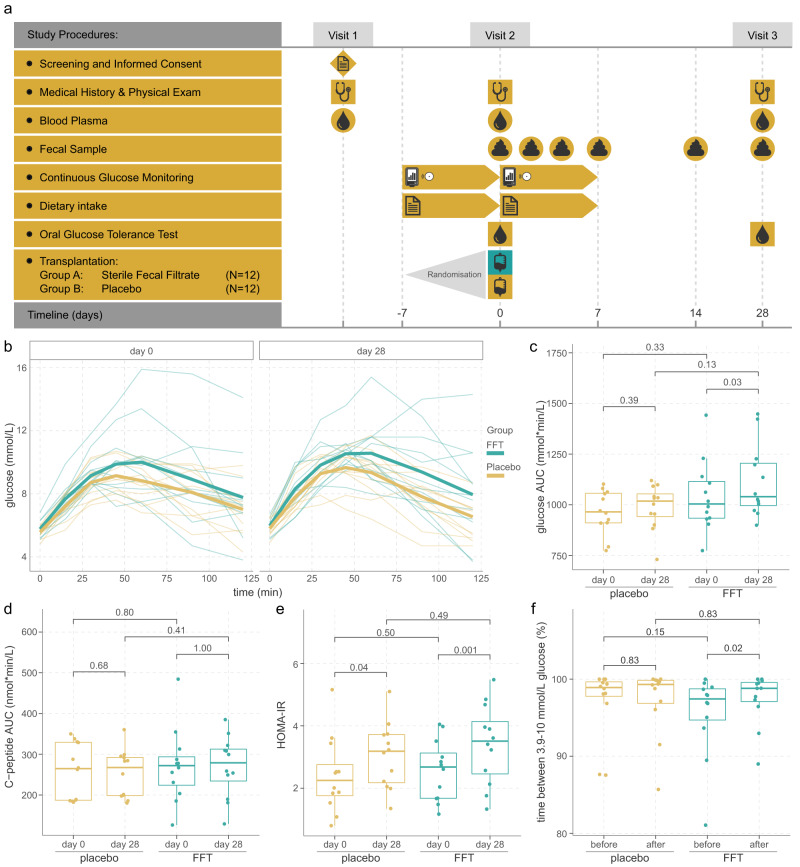
Fig. 1. Study overview and outcomes on glucose metabolism.
a Overview of the study. b Glucose excursions during the oral glucose tolerance test. One person who was randomised to the FFT group had progressed to type 2 diabetes, which was not apparent at the time of screening. c Total area under the curve (AUC) for glucose, and d for C-peptide did not significantly differ between the groups. Within both groups there was a small increase in glucose AUC between day 0 and 28, which was nominal significant within the FFT group, although this significance disappeared after correction for multiple testing. e Insulin resistance (HOMA-IR) measures did not significantly differ between the groups, but significantly increased from day 0 to day 28 in both groups. f Glucose variability, expressed as time between 3.9-10 mmol/L glucose, improved only within the FFT group between day 0 and day 28, which was nominal significant, but disappeared after correcting for multiple testing. Sample size for both FFT and placebo group is n = 12 subjects in all plots. Box plots show the median (middle line), 25th, and 75th percentile (box), with the 25th percentile minus and the 75th percentile plus 1.5 times the interquartile range (whiskers), and outliers (single points). P-values according to paired two-sided Wilcoxon signed-rank test. Source data are provided in the Source Data file.

