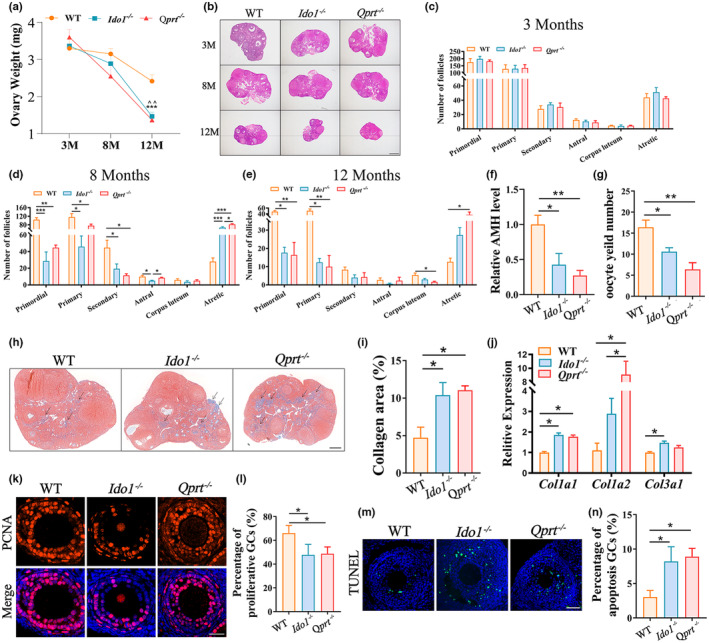
FIGURE 2.

Deletion of Ido1 or Qprt accelerated ovarian senescence. (a) Ovary weight for each group of mice at ages of 3‐, 8‐ and 12‐month (M)‐old (n = 5 mice for each age). ^^: WT VS. Ido1 −/−, p < 0.01; ***: WT VS. Qprt −/−, p < 0.001. (b) Representative hematoxylin and eosin‐stained ovarian sections from 3,8, and 12‐month (M)‐old WT, Ido1 −/− and Qprt −/− mice. Scale bars, 100 μm. (c–e) Quantitative analysis of follicles at different stages in ovarian sections from mice aged 3‐ (c), 8‐ (d) and 12‐month‐old (e) WT, Ido1 −/− and Qprt −/− mice (n = 3 mice for each age). (f) Mean serum AMH levels in the 8‐month‐old WT, Ido1 −/− and Qprt −/− mice (n = 4 mice for each age). (g) The average number of ovulated oocytes after gonadotropin induction of ovulation in the 8‐month‐old WT, Ido1 −/− and Qprt −/− mice (n = 5–8 mice for each group). (h) Ovarian fibrosis examination by using Masson trichrome staining of the ovarian sections from the 8‐month‐old WT, Ido1 −/− and Qprt −/− mice. Arrows showed the positive staining. Scale bar, 200 μm. (i) Quantification of the ratio of blue area to total ovarian sections for each group of mice (n = 3 mice for each group). (j) Transcript levels of fibrosis‐related genes (Col1a1, Col1a2, and Col3a1) in the ovaries detected by real‐time RT‐PCR from 8‐month‐old WT, Ido1 −/− and Qprt −/− mice (n = 3 mice per group). (k) Representative images of PCNA immunofluorescence staining of ovarian sections from 8‐month‐old WT, Ido1 −/− and Qprt −/− mice. Scale bars, 30 μm. (l) Quantification of PCNA‐positive granulosa cells in ovary sections from each group mice (n = 3 mice for each group). (m) Representative images of apoptosis granulosa cells elevated by TUNEL staining from three group mice at the age of 8‐month‐old. Scale bars, 50 μm. (n) Quantitative analysis of TUNEL‐positive granulosa cells in ovarian sections from mice in each group (n = 3 mice for each group). *p < 0.05, **p < 0.01, ***p < 0.001, ^^p < 0.0.
