FIGURE 3.

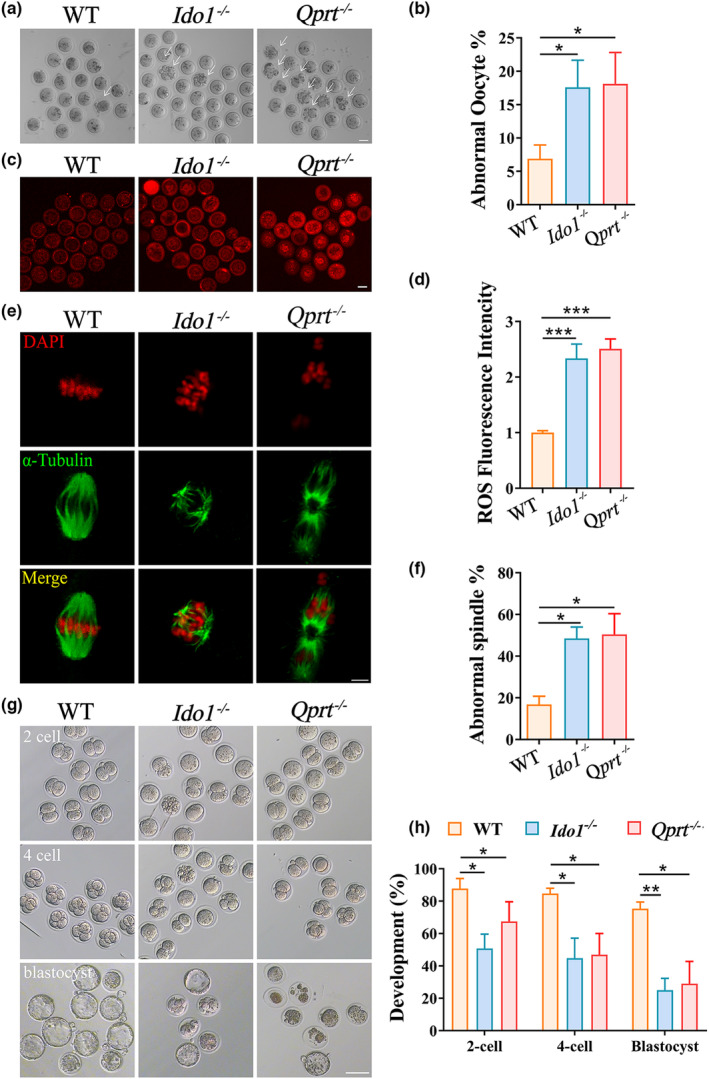
Decreased oocyte quality and lowered embryonic development potential in Ido1 −/− and Qprt −/− mice. (a) Representative images of MII oocytes from 8‐month‐old WT, Ido1 −/− and Qprt −/− mice. Arrows indicate abnormal oocytes with cytoplasmic fragments. Scale bar, 50 μm. (b) The mean percentage of abnormal oocytes (with cytoplasmic fragments) for each group (n = 5 mice for each group). (c) Representative images of ROS levels detected by Mito‐SOX staining in oocytes from WT, Ido1 −/− and Qprt −/− mice at the age of 8‐month‐old. Scale bar, 50 μm. (d) The mean fluorescence pixel intensity of Mito‐SOX in oocytes for each group (n = 32–36 per group). (e) Representative images of spindles and chromosome alignment of MII oocytes from 8‐month‐old WT, Ido1 −/− and Qprt −/− mice. Spindles were visualized by staining using an α‐tubulin antibody (green), and chromosomes were displayed by PI staining (red). Scale bar, 10 μm. (f) The rate of aberrant spindles at MII oocytes from each group (n = 36 oocytes for each group). (g) Representative images of 2‐cell embryos, 4‐cell embryos, and blastocyst from 8‐month‐old WT, Ido1 −/− and Qprt −/− mice. Scale bar, 50 μm. (h) The rates of 2‐cell embryos, 4‐cell embryos, and blastocyst were recorded for each group. (n = 6 mice for each group). *p < 0.05, **p < 0.01, ***p < 0.0.
