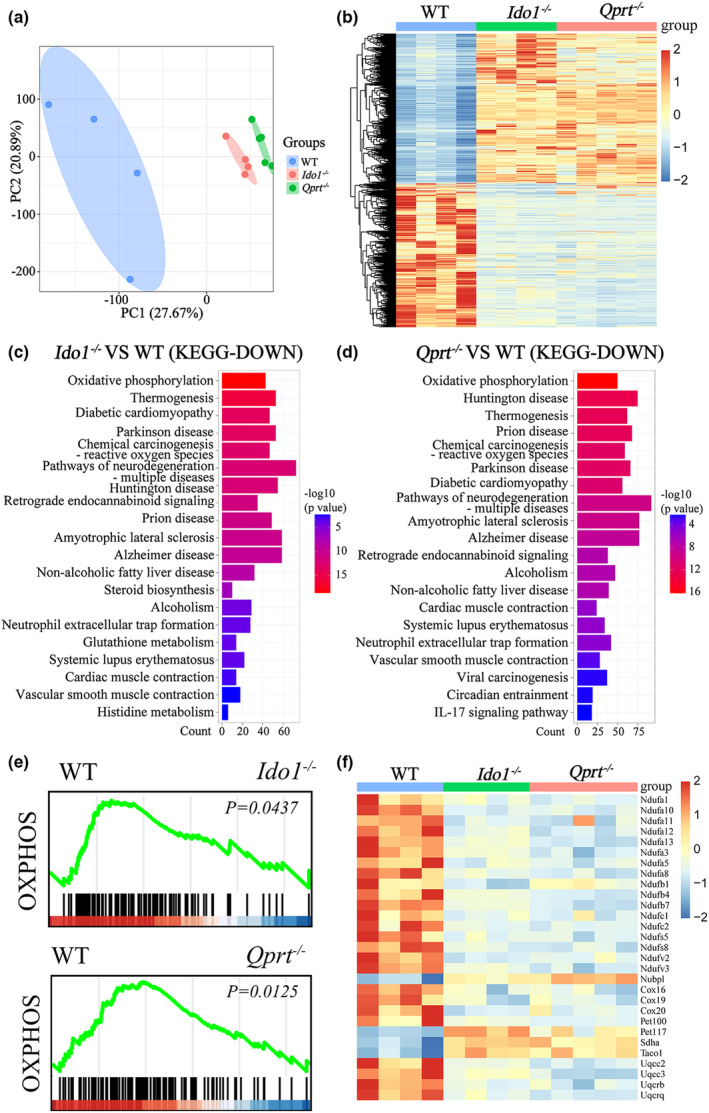
FIGURE 4.

OXPHOS pathway was significantly suppressed in Ido1 −/− and Qprt −/− mice ovaries. (a) Principal component analysis displays the gene expression profile cluster in 8‐month‐old WT, Ido1 −/− and Qprt −/− mice. (b) Heatmap showing genes differentially expressed in the ovaries of 8‐month‐old Ido1 −/− and Qprt −/− mice compared with WT controls. (c, d) Pathway enrichment using KEGG analysis of downregulated DEGs in ovaries from Ido1 −/− (c) and Qprt −/− mice (d) compared with WT mice. The color represents p value, and the x‐axis showed the gene number of downregulated genes from each KEGG annotation among the DEGs. (e) GSEA analysis showing enrichment of suppressed OXPHOS in ovaries from Ido1 −/− and Qprt −/− mice compared with WT mice. (f) Heatmap analysis showing the DEGs in the OXPHOS pathway in Ido1 −/− and Qprt −/− mice ovaries.
