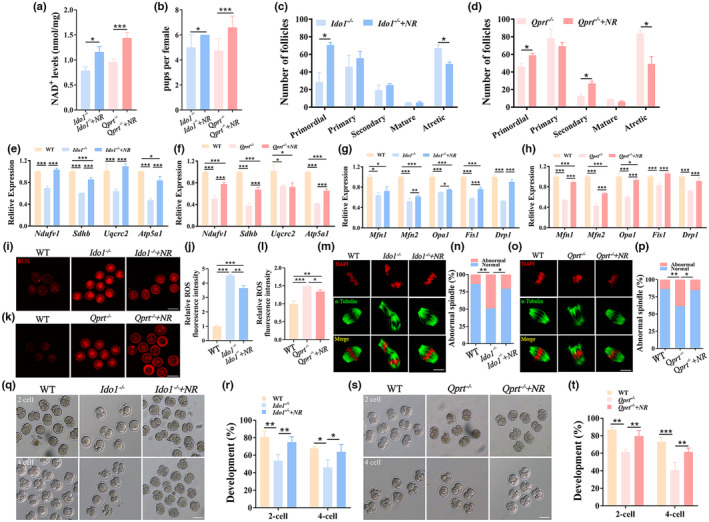
FIGURE 6.

NR supplementation increased ovarian NAD+ levels and recused female fertility in aging Ido1 −/− and Qprt −/− mice. (a) NAD+ levels were determined in ovaries from 8‐month‐old Ido1 −/−, Qprt −/− mice with or without supplementation of NR at the age of 8‐month‐old (n = 3 mice for each group). (b) The mean pups were recorded in Ido1 −/−, Qprt −/− mice after supplementation of NR compared with controls (n = 3 mice for each group). (c, d) The follicle numbers were determined for each stage in the ovaries at the age of 8‐month‐old Ido1 −/−, Ido1 −/− + NR mice (c) and Qprt −/−, Qprt −/− + NR mice (d) (n = 3 mice for each group). (e, f) Transcript levels of mitochondrial electron transport chain complex genes (CI, Ndufv1; CII, Sdhb; CIII, Uqcrc2; CV, Atp5a1) in the ovaries detected by real‐time RT‐PCR from 8‐month‐old Ido1 −/−, Ido1 −/− + NR mice (e) and Qprt −/−, Qprt −/− + NR mice (f) (n = 3 mice per group). (g, h) Transcription analysis of essential dynamic genes for mitochondrial fusion (Mfn1, and Mfn2, Opa1) and fission (Drp1 and Fis1) in the ovaries from 8‐month‐old Ido1 −/−, Ido1 −/− + NR mice (g) and Qprt −/−, Qprt −/− + NR mice (h) (n = 3 mice for each group). (i) Representative images of ROS levels detected by Mito‐SOX staining in oocytes from 8‐month‐old WT, Ido1 −/− and Ido1 −/− mice after supplementation of NR. (j) The mean fluorescence pixel intensity of Mito‐SOX in oocytes for WT, Ido1 −/−, Ido1 −/− + NR mice (n = 6–10 oocytes for each group). (k) Representative images of ROS levels detected by Mito‐SOX staining in oocytes from 8‐month‐old WT, Qprt −/− mice with or without NR supplementation at the age of 8‐month‐old. Scale bars, 100 μm. (l) The mean fluorescence pixel intensity of Mito‐SOX in oocytes for WT, Qprt −/− mice and Qprt −/− + NR mice (n = 8–10 oocytes). (m) Representative images of spindles and chromosome alignment of MII oocytes from 8‐month‐old WT, Ido1 −/− and Ido1 −/− mice after supplementation of NR. Scale bar, 10 μm. (n) The rate of aberrant spindles at MII oocytes from each group (n = 25–27 oocytes for each group). (o) Representative images of spindles and chromosome alignments of MII oocytes from 8‐month‐old WT, Qprt −/−, and Qprt −/− + NR mice. (p) The rate of aberrant spindles at MII oocytes from each group (n = 25–28 oocytes for each group). (q) Representative images of 2‐cell and 4‐cell embryos from 8‐month‐old WT and Ido1 −/− mice with or without supplementation of NR (0.5 μM) in culture medium. Scale bar, 50 μm. (r) The rates of 2‐cell and 4‐cell embryos were recorded for each group (n = 4 mice for each group). (s) Representative images of 2‐cell and 4‐cell embryos from 8‐month‐old WT and Qprt −/− mice with or without supplementation of NR (0.5 μM) in culture medium. Scale bar, 50 μm. (t) The rates of 2‐cell and 4‐cell embryos were recorded for each group (n = 4 mice for each group). *p < 0.05, **p < 0.01, ***p < 0.001.
