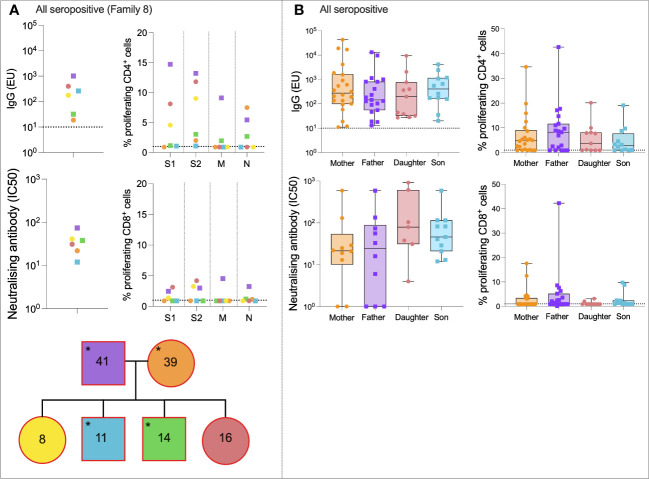
Figure 2.
All seropositive families. Anti-S IgG, nAb responses, CD4+ T-cell responses, and CD8+ responses in a seropositive family group consisting of mother, father, two sons, and two daughters (A). IgG, nAb, and T-cell responses in all individuals from the “All seropositive” family type (B). Male patients are squares; female patients are circles. Seropositive individuals are outlined in red. Asterisks refer to symptomatic individuals. Proliferation values below 1% were given nominal values of 0.9%. Dotted lines refer to cutoffs as determined previously (11, 12).

