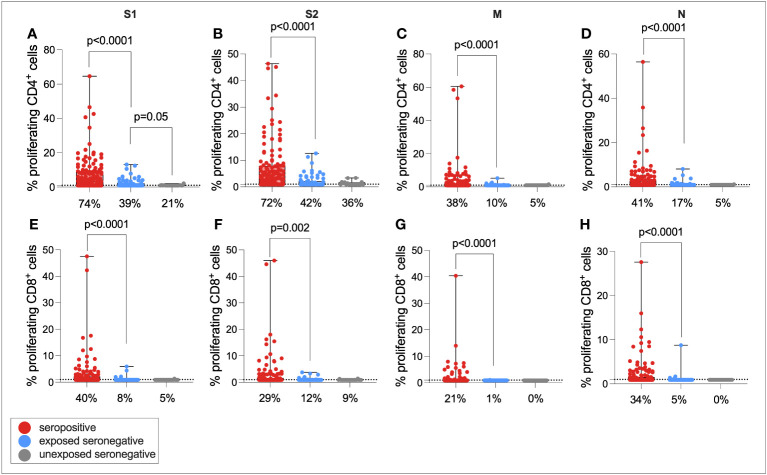
Figure 4.
Cellular immunity in seropositive, ESN, and USN individuals. CD4+ T-cell responses to SARS-CoV-2 S1 (A), S2 (B), M (C), and N (D) as measured by proliferation assay in seropositive individuals (red), ESNs (blue), and USNs (gray). CD8+ T-cell responses to S1 (E), S2 (F), M (G), and N (H) as measured by proliferation assay. p-values refer to Mann–Whitney test values. Data points below 1% were given nominal values of 0.9%. Dotted lines refer to cutoffs as determined previously (11). Percentages refer to the number of individuals with responses above 1% proliferation.

