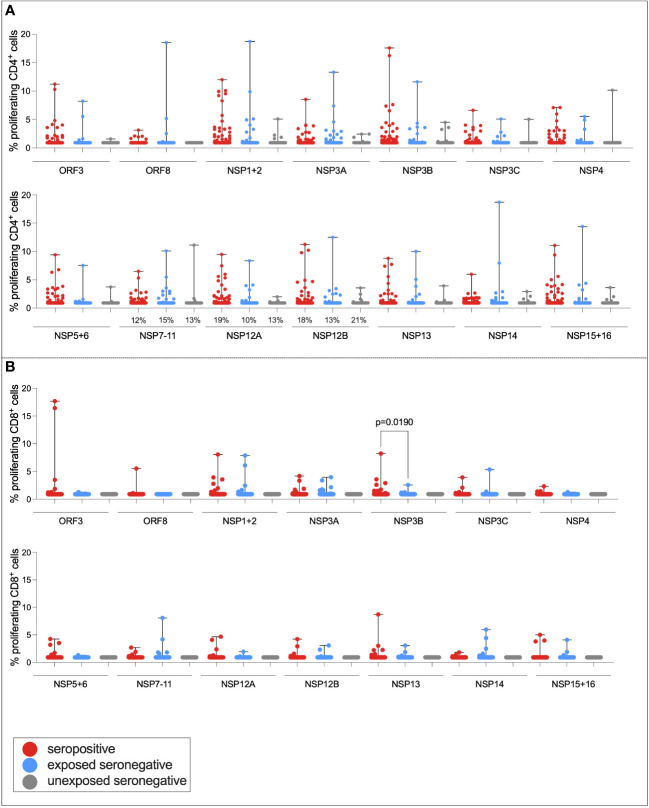
Figure 5.
T-cell responses to NSPs in ESN individuals. CD4+ T-cell responses targeting SARS-CoV-2 NSPs in seropositive (red), ESN (blue), and USN (gray) individuals (A). CD8+ T-cell responses targeting SARS-CoV-2 NSPs in seropositive, ESN and USN individuals (B). Percentages refer to the number of individuals with responses above 1% proliferation, specifically for the RTC region of the genome. p-values refer to Kruskal–Wallis test values with Dunn’s multiple comparisons. Data points below 1% were given nominal values of 0.9%.

