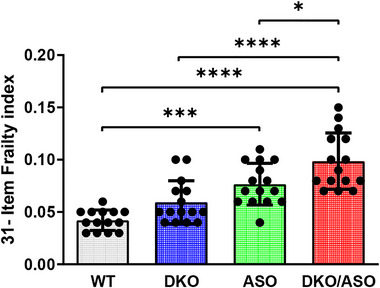
FIGURE 4.

Effect of genotype on frailty. Deficit accumulation based on a 31‐item assessment was used to determine frailty index in mice. Scatter bars represent the mean ± SD of frailty index from n = 14–15 mice per group. Statistically significant differences are indicated as follows: *p ≤ .05; ***p ≤ .001; ****p ≤ .0001.
