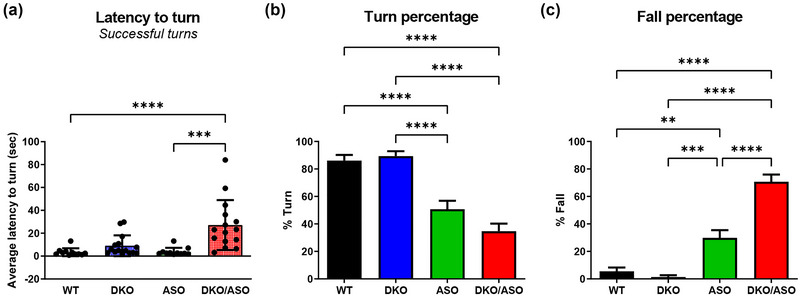
FIGURE 6.

Effect of genotype on motor function assessed by the pole test. (a) The average latency to turn was calculated based on the number of successful turns from five trials. (b) The average turn percentage and (c) average fall percentage per group were also plotted. Scatter bars represent the mean ± SD from n = 11–15 mice per group. Statistically significant differences are indicated as follows: **p ≤ .01; ***p ≤ .001; ****p ≤ .0001.
