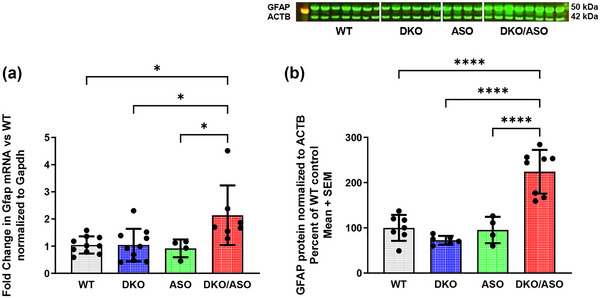
FIGURE 11.

Effect of genotype on expression of striatal Glial fibrillary acidic protein ( GFAP). Fold change of GFAP mRNA expression relative to WT mice was analyzed by quantitative PCR (qPCR) (a), and the semi‐quantitation of GFAP protein expression (b) was analyzed by western blot in the striatum of WT, DKO, ASO, and DKO/ASO mice. The bands represent GFAP and ACTB detected at 50 kDa and 42 kDa, respectively. GAPDH and actin were used as loading controls for qPCR and western blot, respectively. Scatter bars represent the mean ± SD from n = 4–10 per group. Asterisks represent significant differences as follows: *p ≤ .05; ****p ≤ .0001.
