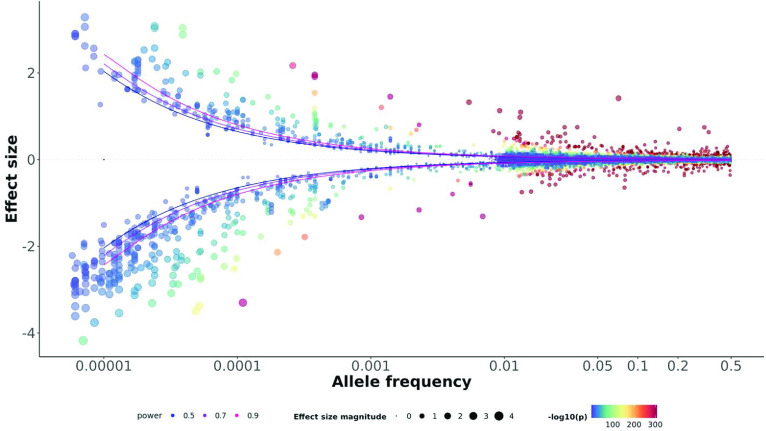
Figure 1.
Distribution of allele frequencies and effect sizes for genetic associations across 129 continuous traits from the UK Biobank. Power curves for statistical power of 0.5 (blue), 0.7 (purple) and 0.9 (pink) were constructed for the median genome-wide association study sample size (N = 351,550). The colours of the dots represent the −log10 of the association P-value. The size of the dot is proportional to the effect size (represented in the y-axis). Information for each individual variant (variant name, effect size, gene name (if applicable) P-value, and trait name) is displayed when hovering a mouse cursor over each dot. Due to file size limits, the interactive version does not display variants with effect size lower than 0.05. Please see the supporting data [26] for a static version with all variants across the 129 traits. figure-1.html

