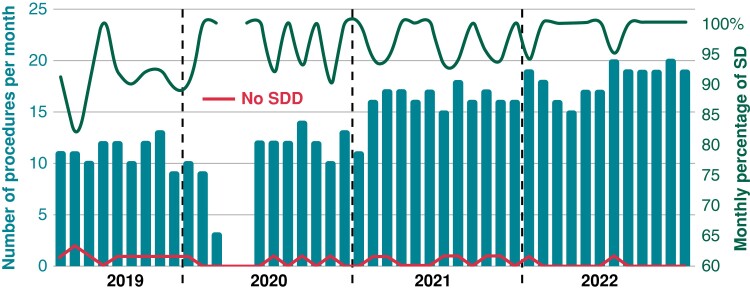
Figure 2.
Graph showing the time course of early discharges after the PVI procedure. The blue columns refer to the number of PVI procedures per month, the red line indicates the number of patients who were hospitalized after the procedure, and the green line represents the monthly percentage of SDD. PVI, pulmonary vein isolation; SDD, same-day discharge.

