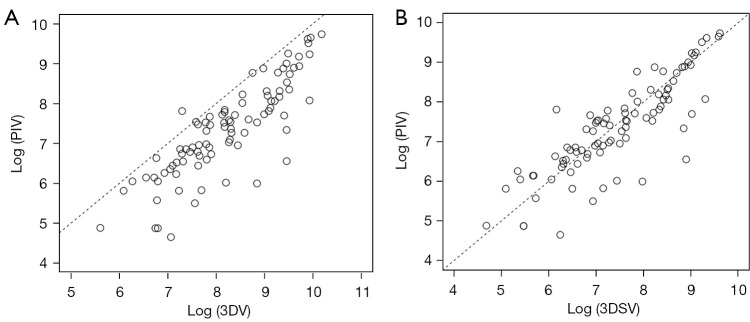
Figure 4.
Scatter plots showing the relationship between PIV and radiological parameters for 90 solid lung adenocarcinomas. The dashed line indicated an equal value between the x and y axis. PIV was smaller than 3DV (A) and similar to 3DSV (B). The mean square error for 3DV and 3DSV were 1.1523 and 0.420, respectively. PIV, pathological invasive volume; 3DV, three-dimensional tumor volume between −600 and 199 HU; 3DSV, three-dimensional solid volume between 0 and 199 HU.

