Figure 5.
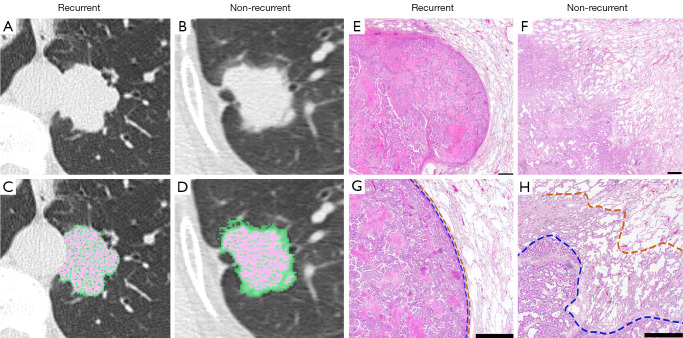
Representative of recurrent and non-recurrent cases similar to 3DV. Axial and 3DSV CT images for recurrent and non-recurrent case (A-D). Low-power and high-power histopathologic images with hematoxylin and eosin staining for recurrent and non-recurrent case (E-H). Blue and red lines indicate invasive and lepidic boundary. Pink area in (C) and (D) shows solid component with 0–199 HU, and measured values of 3DV, 3DSV, and PIV were 13,237 mm3 (recurrent) and 12,913 mm3 (non-recurrent), 9,043 mm3 (recurrent) and 5,644 mm3 (non-recurrent), 10,472 mm3 (recurrent) and 5,079 mm3 (non-recurrent), respectively. Although 3DV was similar between two cases, 3DSV was higher in recurrent cases than in non-recurrent case. PIV was close to 3DSV in both cases. Scale bar in the histopathological images indicates 1 mm. 3DV, three-dimensional tumor volume between −600 and 199 HU; 3DSV, three-dimensional solid volume between 0 and 199 HU; CT, computed tomography; PIV, pathological invasive volume.

